Stock Analysis · Tikehau Capital (TKKHF)
Overview
Tikehau Capital is a French alternative asset manager and investment group. In simple terms, it manages money for institutions and wealthy clients in strategies that sit mostly outside traditional stock-and-bond funds. Its business is built around private debt, private equity, real assets, and capital markets strategies. It also invests part of its own balance sheet alongside clients, which means reported earnings can reflect both recurring management activity and the changing value of investments it holds directly.
This matters for long-term analysis because Tikehau is not a plain-vanilla asset manager. Part of its income is recurring and linked to assets under management, while another part is more variable and depends on deal activity, investment exits, performance fees, and market conditions. That mix can create attractive upside in strong periods, but it also makes results less predictable than those of a traditional fee-only manager.
Based on the company’s recent annual reporting and business structure, the main economic drivers are broadly the following:
- Management and advisory fees: the largest and most recurring source of revenue. These fees are earned for managing client capital across private debt, private equity, real assets, and liquid strategies. In alternative asset management groups, this usually represents the core operating engine.
- Performance fees: earned when funds or mandates exceed predefined targets. This can be meaningful in good years but is naturally irregular.
- Investment income from Tikehau Capital’s own balance sheet: returns from capital invested alongside clients, including fair-value movements, interest income, dividends, and gains on disposals. This can materially influence net profit.
- Other advisory and transaction-related income: a smaller source tied to structuring, arranging, or supporting deals and investment vehicles.
By strategy, Tikehau’s platform has historically been led by private debt, followed by real assets, private equity, and a smaller capital markets activity. Exact percentages can shift from year to year depending on fundraising and valuation movements, but private debt has generally been the largest pillar of assets under management.
The business profile therefore combines two layers: a fee-based franchise that can scale as assets under management grow, and a principal investment arm that can enhance returns but also increase earnings volatility.
The broad financial flow shows a business that has kept revenue moving upward over the last several years, but with more pressure on operating income and net income than top-line growth alone would suggest. That pattern fits an alternative manager exposed to fundraising cycles, deployment timing, and the valuation swings of assets held on its own balance sheet.
Key Figures
| Metric | Value | Sector ⓘ |
|---|---|---|
| Date | Oct 24, 2026 | |
| Context | ||
| Sector | Financial Services | |
| Industry | Asset Management | |
| Market Cap ⓘ | $3.26B | |
| Beta ⓘ | 0.69 | |
Value (Cheapness) | ||
| P/E Ratio ⓘ | 12.89 | 12.46 |
| P/B Ratio ⓘ | 1.05 | 1.25 |
| FCF Yield ⓘ | 2.57% | 9.82% |
| Dividend Yield ⓘ | 4.22% | 2.94% |
| EBIT / EV ⓘ | N/A | 8.11% |
| PEG ⓘ | N/A | |
Growth (Business expansion) | ||
| Revenue Growth ⓘ | 135.40% | 9.10% |
| RPS Growth (5Y CAGR) ⓘ | -0.49% | 12.31% |
| EPS Growth (5Y CAGR) ⓘ | -27.61% | -6.97% |
| BVPS Growth (5Y CAGR) ⓘ | -1.84% | 5.02% |
| Margin Growth (5Y Trend) ⓘ | -49.86% | -4.00% |
| FCF Growth (5Y CAGR) ⓘ | 25.20% | 4.71% |
| DPS Growth (5Y CAGR) ⓘ | 16.73% | 8.92% |
Quality (Business durability) | ||
| ROIC (Latest) ⓘ | N/A | 9.18% |
| ROE (Latest) ⓘ | 13.08% | 13.93% |
| ROA (Latest) ⓘ | 8.02% | 1.57% |
| ROIC (5Y Median) ⓘ | 4.21% | 7.80% |
| ROE (5Y Median) ⓘ | 5.59% | 12.15% |
| ROA (5Y Median) ⓘ | 3.61% | 1.28% |
| Net Debt / EBIT (Latest) ⓘ | N/A | 1.02 |
| Net Debt / EBIT (5Y Median) ⓘ | 4.82 | 0.72 |
| Net Debt / EBITDA (Latest) ⓘ | 2.27 | 0.88 |
| Operating Margin (Latest) ⓘ | N/A | 22.30% |
| Operating Margin (5Y Median) ⓘ | 48.48% | 24.50% |
| Debt to Equity (Latest) ⓘ | 57.11% | 59.34% |
| Profit Margin (Latest) ⓘ | 34.71% | 26.42% |
| Free Cash Flow (Latest) ⓘ | $83.90M | |
Momentum (Price trend) | ||
| 3Y Return ⓘ | -10.82% | +95.73% |
| 12M Return (excl. last month) ⓘ | -4.27% | +17.30% |
| 6M Return ⓘ | +12.73% | +6.07% |
| Price vs. 200-Day MA ⓘ | N/A | +5.36% |
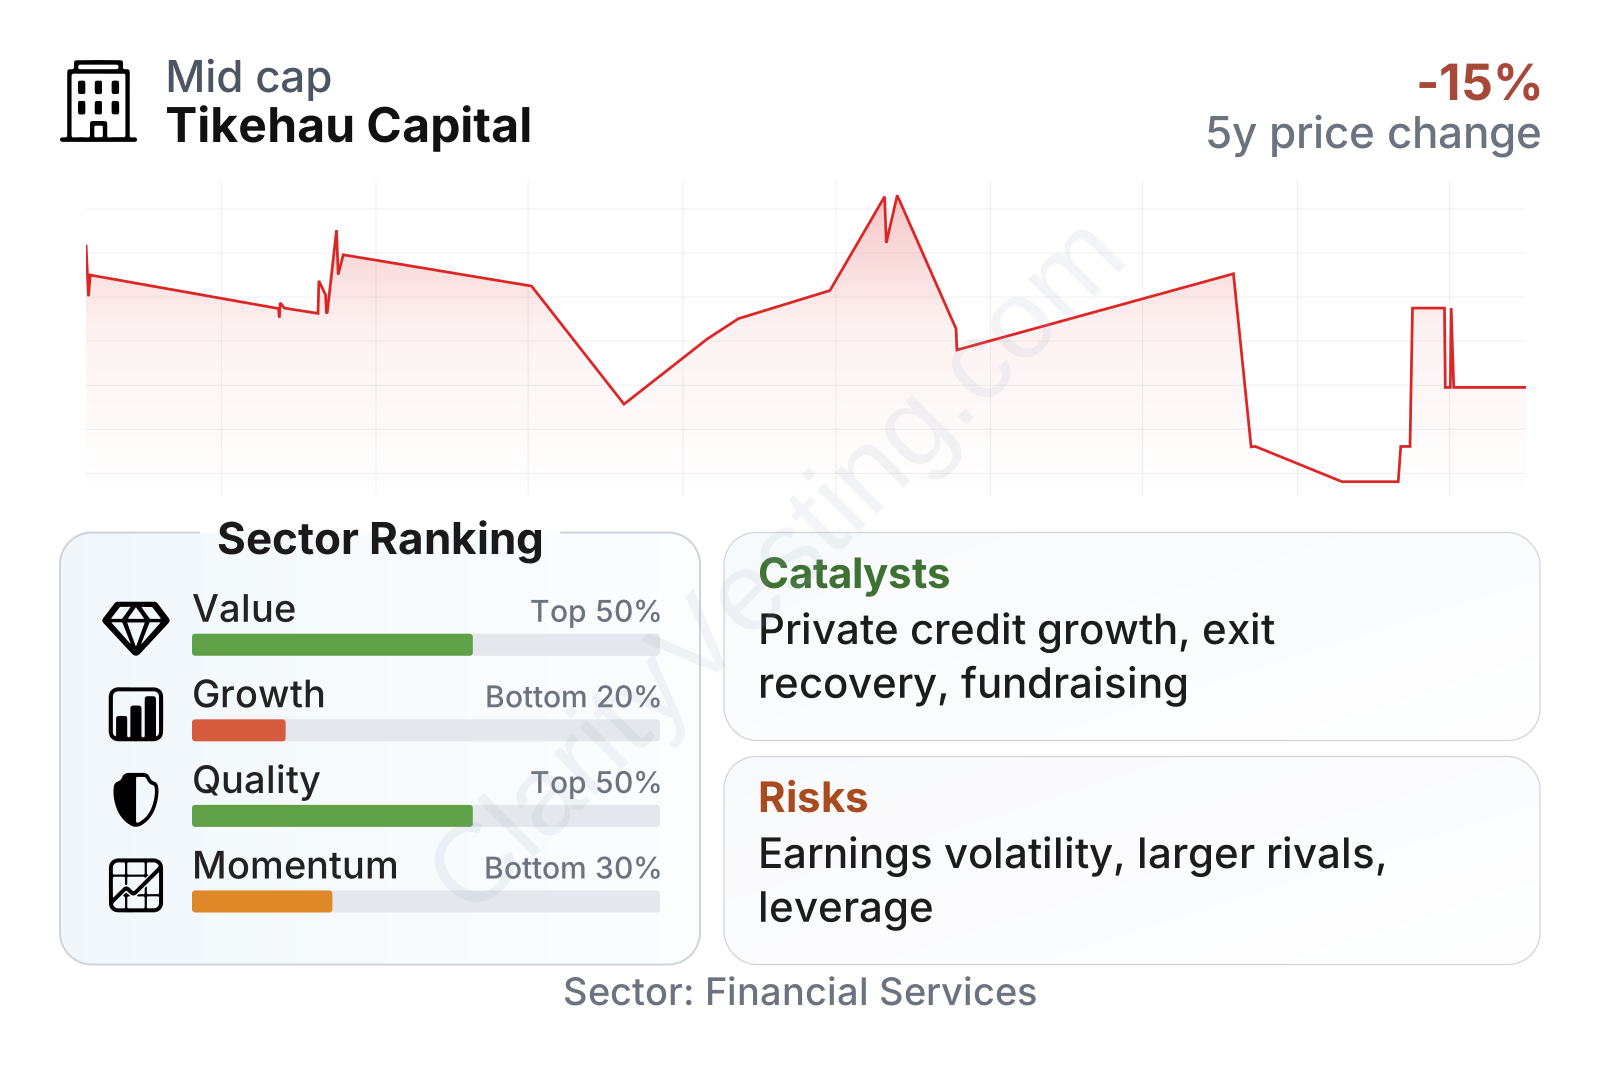
Tikehau Capital sits in the middle of the pack on valuation and overall quality within financial services, but weaker on growth and recent share-price momentum. Profitability remains solid, with return on assets clearly above the sector median and profit margin also ahead of many peers. The more mixed point is consistency: five-year earnings and book value trends have been soft, and leverage measured against EBITDA is higher than the sector median. The dividend yield is comparatively attractive, while free cash flow yield looks less generous than many peers.
The share price has not kept pace with the broader financial sector over the last few years. That underperformance appears to reflect investor caution around slower compounding in earnings and book value rather than a collapse in the underlying franchise.
Growth
Tikehau operates in a segment with favorable long-term industry tailwinds. Alternative asset management has expanded as pension funds, insurers, sovereign funds, and private wealth clients have searched for income, diversification, and access to private markets. Areas such as private credit, infrastructure, energy transition financing, and asset-backed strategies have remained especially relevant as banks have become more selective lenders and institutional clients have looked beyond listed markets.
Tikehau’s strategy makes sense within that backdrop. Its strongest positioning is in private debt, a category that has benefited from tighter bank lending, higher demand for direct financing, and growing institutional familiarity with private credit as an asset class. The firm has also developed exposure to real assets and decarbonization-related themes, which could support fundraising over time if institutional capital continues to shift toward infrastructure, energy efficiency, and long-duration assets.
Another positive feature is the combination of third-party asset management and balance-sheet co-investment. If executed well, that model can improve alignment with clients and create additional upside from successful investments. It can also help seed new strategies and attract capital. The trade-off, however, is that growth in headline earnings may not look smooth from one year to the next.
Book value per share has been broadly stable after an earlier decline, rather than showing strong upward compounding. For a financial company that invests alongside clients, that is an important signal. It suggests the platform has preserved capital reasonably well in recent years, but it has not yet translated into a powerful per-share compounding profile.
A relevant catalyst in the current environment is the continued institutional buildout of private credit in Europe. Tikehau is based in Europe but operates internationally, so it is positioned to benefit if European borrowers keep shifting toward non-bank funding sources. A second potential catalyst is normalization in exit markets. If private equity and other illiquid assets see a healthier environment for disposals and realizations, performance fees and investment gains could recover more strongly. A third catalyst is further fundraising from insurers, pension schemes, and private wealth distribution channels, where scale matters and established managers tend to gain the first look.
Recent company communication has also emphasized product expansion, international fundraising, and thematic investment areas such as energy transition and defense-related financing. These are not guaranteed growth engines, but they do fit areas where public and private capital demand has been increasing across Europe.
Risks
This article is for informational purposes only and does not constitute financial advice. Some content is AI-generated. See Disclaimer


