Stock Analysis · The Hanover Insurance Group Inc (THG)
Overview
The Hanover Insurance Group is a U.S. property and casualty insurer. In simple terms, it collects premiums from individuals and businesses in exchange for covering losses from events such as auto accidents, home damage, business interruptions, workers’ compensation claims, and other liability exposures. The company focuses on independent insurance agents and brokers rather than a direct-to-consumer model, which shapes both its distribution strategy and its customer mix.
Its business is organized mainly into personal lines, commercial lines, and specialty operations. Based on the latest annual reporting structure, revenue is driven primarily by earned premiums, supplemented by investment income generated from the insurer’s portfolio of bonds and other invested assets. Approximate revenue mix can be understood through net written premium trends and segment disclosures:
- Commercial lines: about 45% to 50% of premiums. This includes small and mid-sized business insurance such as commercial auto, workers’ compensation, property, and general liability.
- Personal lines: about 30% to 35% of premiums. This mainly includes personal automobile, homeowners, and other personal coverages sold through independent agents.
- Specialty: about 20% to 25% of premiums. This area includes more specialized coverages and programs, often serving niche professional or industry-specific risks.
- Net investment income: a smaller but meaningful share of total revenue. Like most insurers, Hanover invests the premium float before claims are paid, creating an additional earnings stream that becomes more helpful when interest rates are higher.
The business model is fairly straightforward: write policies at disciplined prices, limit losses through underwriting and reinsurance, and earn a solid return on invested assets. Over the last few years, the company’s profit path has been uneven because catastrophe losses and claims inflation hit the industry hard, but the underlying engine remains premium growth plus investment income.
The profit flow shows a clear recovery after a difficult 2022-2023 period. Revenue kept rising through the downturn, while profitability improved sharply in 2024 and again in 2025, which suggests pricing actions and underwriting discipline started to overcome elevated claims costs.
Key Figures
| Metric | Value | Sector ⓘ |
|---|---|---|
| Date | Oct 17, 2026 | |
| Context | ||
| Sector | Financial Services | |
| Industry | Insurance - Property & Casualty | |
| Market Cap ⓘ | $7.88B | |
| Beta ⓘ | 0.25 | |
Value (Cheapness) | ||
| P/E Ratio ⓘ | 10.65 | 12.26 |
| P/B Ratio ⓘ | 2.26 | 1.23 |
| FCF Yield ⓘ | 15.91% | 10.40% |
| Dividend Yield ⓘ | 1.69% | 3.02% |
| EBIT / EV ⓘ | 12.43% | 8.14% |
| PEG ⓘ | 0.34 | |
Growth (Business expansion) | ||
| Revenue Growth ⓘ | 4.30% | 9.35% |
| RPS Growth (5Y CAGR) ⓘ | 6.86% | 12.19% |
| EPS Growth (5Y CAGR) ⓘ | 18.90% | -9.53% |
| BVPS Growth (5Y CAGR) ⓘ | 3.73% | 4.99% |
| Margin Growth (5Y Trend) ⓘ | 2.68% | -3.86% |
| FCF Growth (5Y CAGR) ⓘ | 9.45% | 4.81% |
| DPS Growth (5Y CAGR) ⓘ | 6.84% | 8.79% |
Quality (Business durability) | ||
| ROIC (Latest) ⓘ | 17.16% | 9.49% |
| ROE (Latest) ⓘ | 21.29% | 13.90% |
| ROA (Latest) ⓘ | 4.49% | 1.55% |
| ROIC (5Y Median) ⓘ | 16.51% | 7.86% |
| ROE (5Y Median) ⓘ | 13.19% | 12.17% |
| ROA (5Y Median) ⓘ | 2.85% | 1.30% |
| Net Debt / EBIT (Latest) ⓘ | 0.57 | 0.96 |
| Net Debt / EBIT (5Y Median) ⓘ | 0.99 | 0.73 |
| Net Debt / EBITDA (Latest) ⓘ | 0.57 | 0.92 |
| Operating Margin (Latest) ⓘ | 15.00% | 22.30% |
| Operating Margin (5Y Median) ⓘ | 9.20% | 24.63% |
| Debt to Equity (Latest) ⓘ | 22.98% | 58.56% |
| Profit Margin (Latest) ⓘ | 11.17% | 26.57% |
| Free Cash Flow (Latest) ⓘ | $1.25B | |
Momentum (Price trend) | ||
| 3Y Return ⓘ | +106.47% | +88.33% |
| 12M Return (excl. last month) ⓘ | +34.52% | +19.38% |
| 6M Return ⓘ | +30.12% | +4.75% |
| Price vs. 200-Day MA ⓘ | +16.84% | +3.50% |
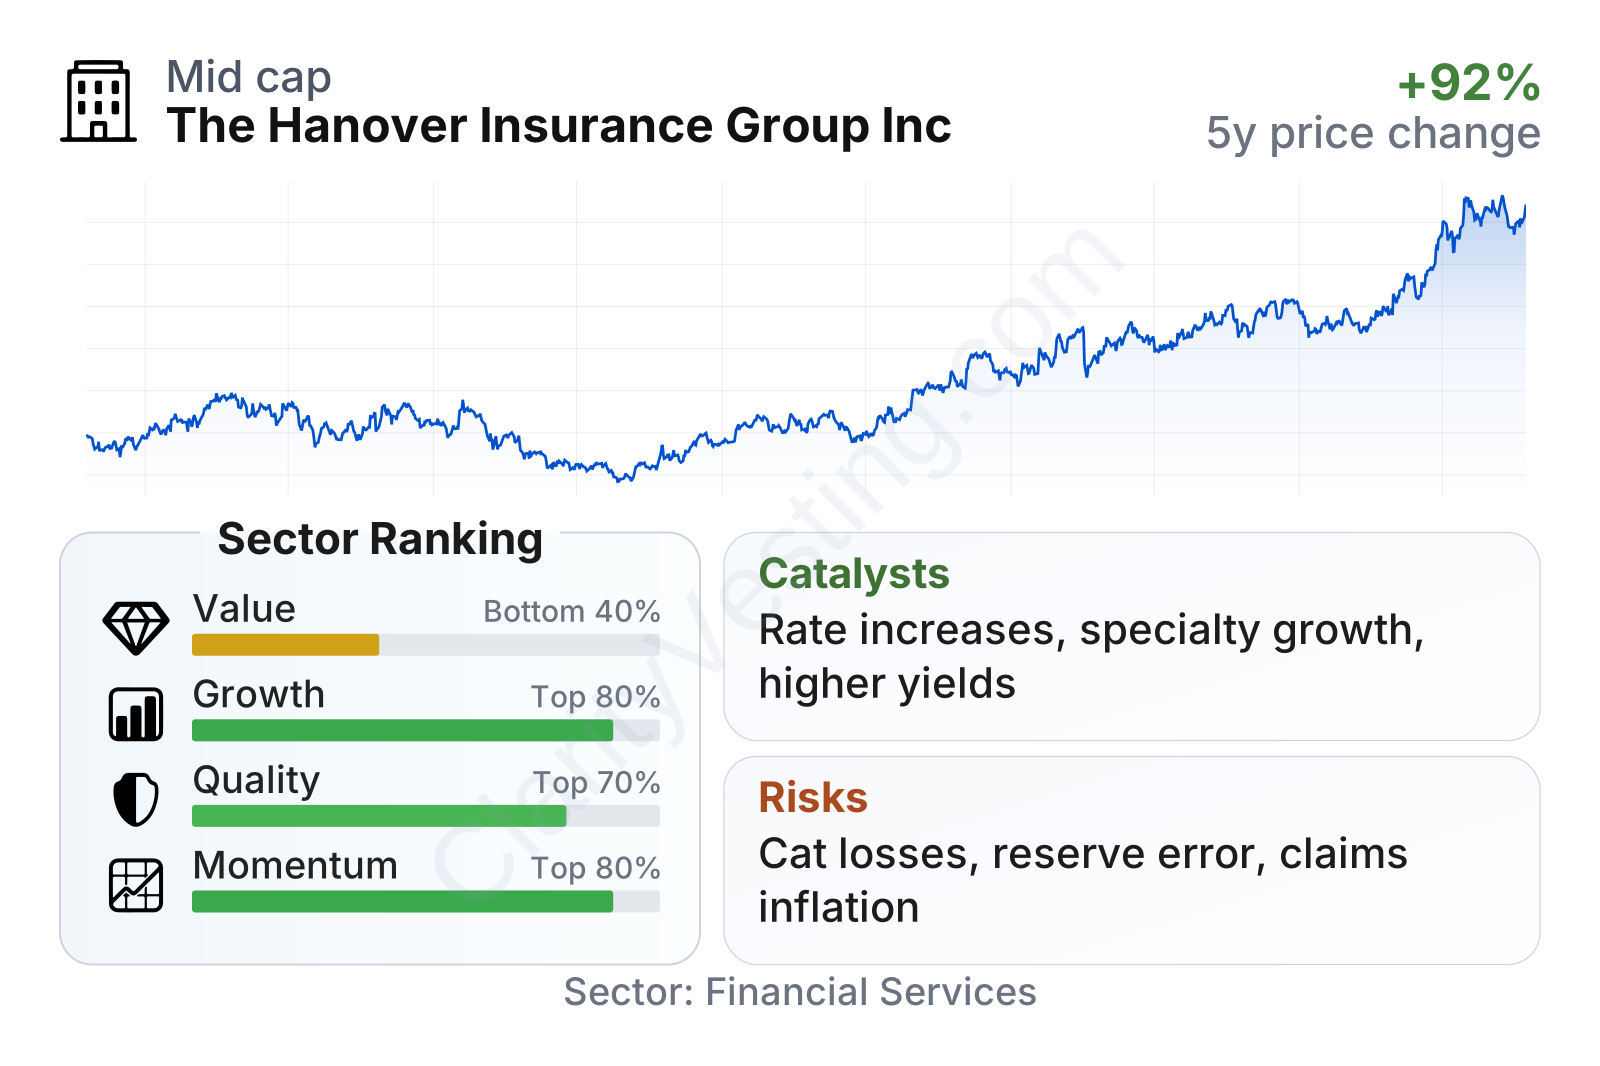
Hanover is a mid-sized insurer with a market value in the several-billion-dollar range and a notably low beta, meaning its stock has historically moved less than the broader market. The quality profile stands out: returns on equity and assets are well above sector medians, and leverage appears moderate with debt-to-equity near 23%, well below the sector median. Growth metrics are more mixed. Earnings growth over five years has been strong, but revenue growth has trailed the sector median, reflecting the slower, more cyclical nature of insurance pricing and claims conditions. On valuation, the stock does not look expensive on earnings, but it does trade at a premium on book value relative to the sector, implying the market is assigning extra value to the recent improvement in profitability.
The share price trend has also been strong. After weakness during the industry’s more difficult claims environment, the stock rebounded sharply and has meaningfully outperformed the sector over the last 6 months, 12 months, and 3 years.
Growth
Property and casualty insurance is not a high-growth industry in the way software or semiconductors can be, but it is a large and necessary market that tends to grow over time with higher insured values, economic activity, replacement costs, and premium rate increases. That makes it a durable sector rather than a rapidly expanding one. Hanover’s growth case is therefore less about disruption and more about disciplined execution: writing business selectively, repricing risk when loss costs rise, keeping retention healthy, and using its specialty and independent-agent relationships to defend margins.
A key point for long-term analysis is that the company has recently shown a strong earnings recovery. That matters because insurers can look weak for a period when claims severity, catastrophe losses, or inflation pressure results, then recover as pricing catches up. Hanover’s earnings per share moved from a depressed level in 2023 to a much stronger level in 2024 and 2025, indicating a significant reset in profitability rather than simple top-line expansion.
The earnings trend suggests the company has regained pricing power and underwriting balance after a difficult stretch. That is often more important in insurance than raw revenue growth because profitable premium is what ultimately matters.
Book value per share is another important measure for insurers because it reflects the capital base that supports underwriting. Hanover’s book value was hit during the tougher period, then recovered strongly, reaching a new high by 2025. That improvement supports the view that recent profits are rebuilding financial strength rather than only lifting short-term earnings.
Strategically, Hanover appears well positioned in areas where disciplined underwriting can still create value. Its emphasis on independent agents can be an advantage in commercial and specialty business, where local relationships, service quality, and product breadth matter more than pure scale. Higher interest rates have also supported industry investment income, which adds another tailwind compared with the very low-rate environment that pressured insurers for years.
Recent company communications have also pointed to continued rate adequacy efforts, underwriting actions in personal auto and property, and growth in targeted specialty and core commercial lines. Those are not dramatic catalysts, but they are meaningful because insurance turnarounds are often built through a sequence of pricing and portfolio decisions rather than one transformative event.
Risks
This article is for informational purposes only and does not constitute financial advice. Some content is AI-generated. See Disclaimer


