Stock Analysis · Target Hospitality Corp (TH)
Overview
Target Hospitality Corp operates lodging, housing, and hospitality services for customers that need large-scale workforce accommodations or temporary housing solutions. In simple terms, the company builds, owns, manages, and services communities where people can live while working on remote industrial projects or while receiving government-related housing support. Its sites typically include rooms, food services, utilities, security, recreation areas, and day-to-day property management.
The business is centered on two main activities: workforce housing for industries such as energy and infrastructure, and government-related housing services. The company’s model is less about one-time construction revenue and more about recurring income from contracts tied to occupied beds, property services, and site operations.
Based on recent company reporting, revenue is mainly generated from the following sources:
- Government segment: approximately 55% to 65% of revenue in recent periods. This includes hospitality and facilities services provided under government contracts, most notably family and humanitarian housing programs.
- Hospitality & Facilities Services segment: approximately 35% to 45% of revenue. This includes workforce lodging communities, camp services, food service, housekeeping, security, and other property-related support for corporate customers.
The revenue mix has shifted over time depending on contract activity, especially large government programs and customer demand in energy-producing regions. This makes the company more concentrated than many traditional service businesses, but it also means contract wins can move results quickly.
Over the last several years, the business showed a sharp improvement from 2021 to 2023, followed by a meaningful slowdown in 2024 and weaker profitability in 2025. That pattern suggests Target Hospitality is highly operationally leveraged: when utilization and contract activity are strong, margins can expand quickly; when occupancy falls or large contracts roll off, earnings can reverse just as fast.
The long-term pattern shows how strongly profits depend on contract volume. Revenue and operating income climbed sharply through 2023, then weakened materially in 2024 and turned negative at the operating line in 2025, even though the company kept overhead relatively contained. That is a useful reminder that this is a contract-driven business rather than a steady utility-like operator.
Key Figures
| Metric | Value | Sector ⓘ |
|---|---|---|
| Date | Oct 10, 2026 | |
| Context | ||
| Sector | Industrials | |
| Industry | Specialty Business Services | |
| Market Cap ⓘ | $1.82B | |
| Beta ⓘ | 1.49 | |
Value (Cheapness) | ||
| P/E Ratio ⓘ | N/A | 22.32 |
| P/B Ratio ⓘ | 4.94 | 1.98 |
| FCF Yield ⓘ | 4.90% | 6.34% |
| Dividend Yield ⓘ | N/A | 1.95% |
| EBIT / EV ⓘ | -1.82% | 4.71% |
| PEG ⓘ | 1.68 | |
Growth (Business expansion) | ||
| Revenue Growth ⓘ | 38.70% | 9.25% |
| RPS Growth (5Y CAGR) ⓘ | 1.67% | 7.75% |
| EPS Growth (5Y CAGR) ⓘ | N/A | -13.37% |
| BVPS Growth (5Y CAGR) ⓘ | 40.41% | 6.12% |
| Margin Growth (5Y Trend) ⓘ | -21.73% | 0.81% |
| FCF Growth (5Y CAGR) ⓘ | -45.05% | 11.01% |
| DPS Growth (5Y CAGR) ⓘ | -64.27% | 9.48% |
Quality (Business durability) | ||
| ROIC (Latest) ⓘ | -7.47% | 10.70% |
| ROA (Latest) ⓘ | -6.30% | 5.38% |
| ROIC (5Y Median) ⓘ | 14.56% | 9.26% |
| ROA (5Y Median) ⓘ | 10.04% | 4.94% |
| Net Debt / EBIT (Latest) ⓘ | N/A | 2.08 |
| Net Debt / EBIT (5Y Median) ⓘ | 0.79 | 2.29 |
| Net Debt / EBITDA (Latest) ⓘ | 0.07 | 1.43 |
| Net Debt / Assets ⓘ | 0.34% | 19.34% |
| EBITDA / Interest ⓘ | 10.64 | 9.54 |
| Operating Margin (Latest) ⓘ | -11.08% | 10.34% |
| Operating Margin (5Y Median) ⓘ | 28.34% | 10.29% |
| Debt to Equity (Latest) ⓘ | 2.24% | 65.52% |
| Profit Margin (Latest) ⓘ | -10.85% | 6.63% |
| Free Cash Flow (Latest) ⓘ | $89.01M | |
Momentum (Price trend) | ||
| 3Y Return ⓘ | +16.90% | +61.33% |
| 12M Return (excl. last month) ⓘ | +122.32% | +14.82% |
| 6M Return ⓘ | +32.99% | +3.53% |
| Price vs. 200-Day MA ⓘ | +29.28% | +0.88% |
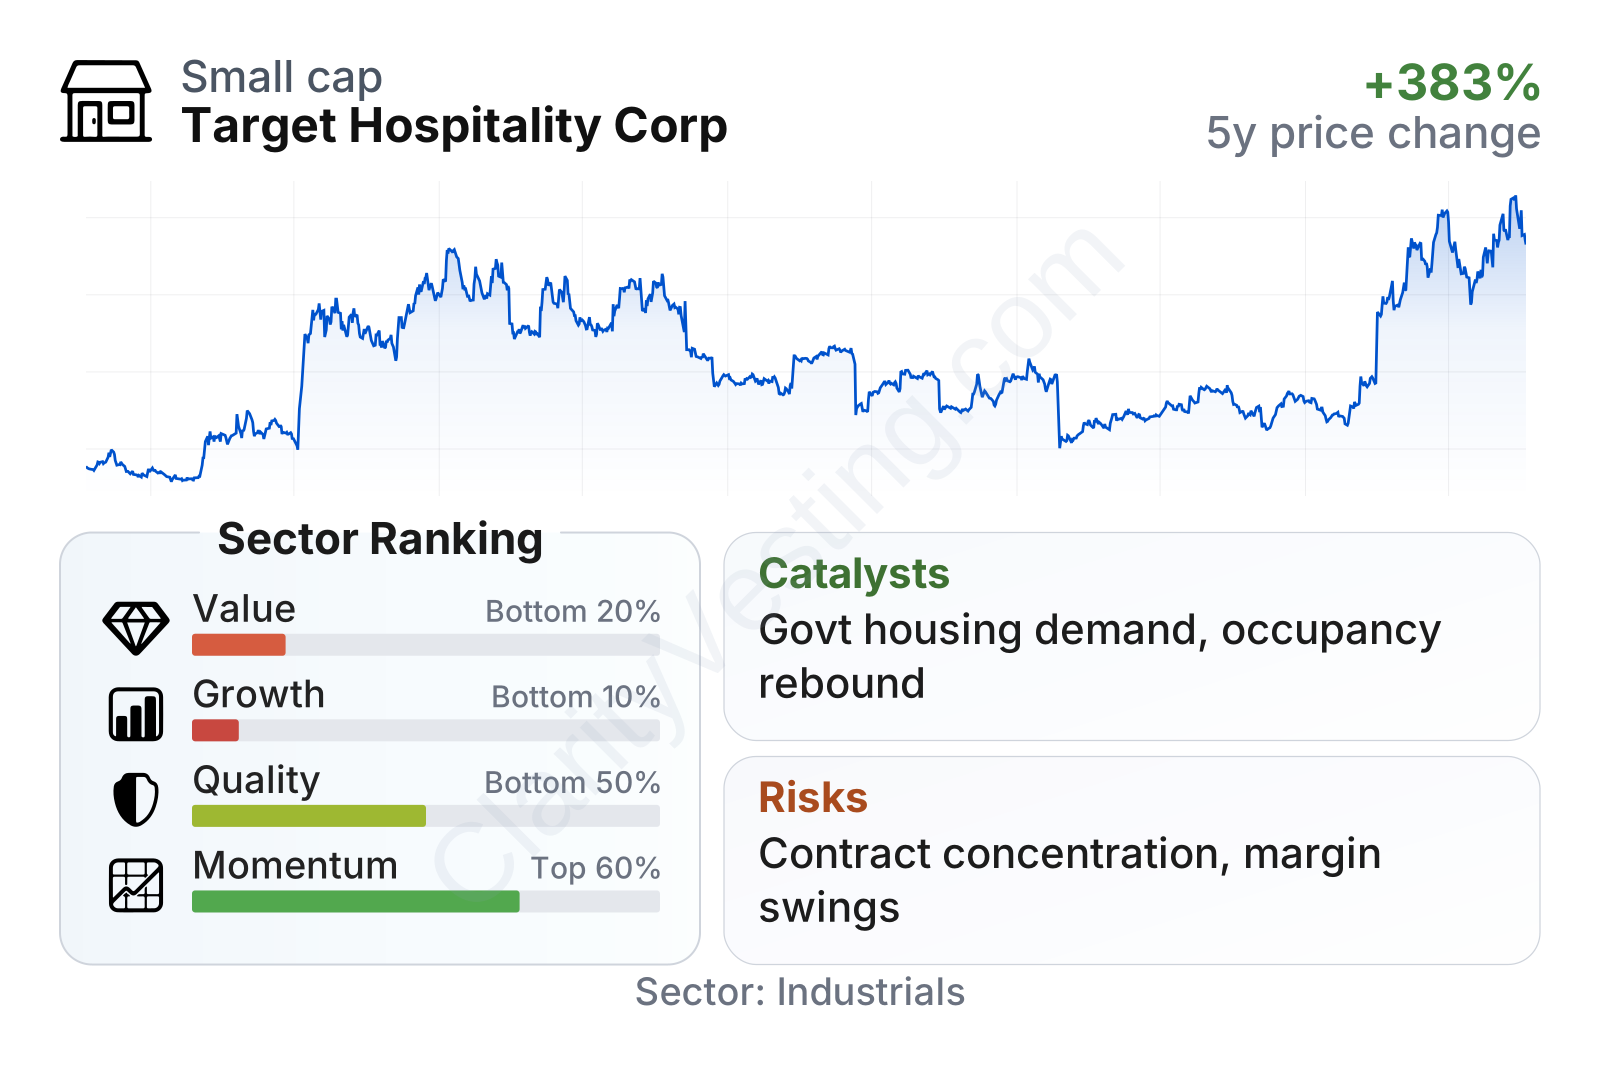
Target Hospitality is a mid-cap company with a stock that has been much more volatile than the broader market, which fits the company’s dependence on a relatively small number of large contracts. The current factor picture is mixed. Recent share-price momentum has been very strong, and the balance sheet looks unusually conservative for the sector, with very low debt levels and solid interest coverage. On the other hand, recent profitability and returns on capital have weakened sharply, and several valuation measures do not screen as cheap relative to the sector despite the company’s cyclical earnings profile.
Growth
Target Hospitality operates in niches that can grow for practical, non-speculative reasons. Remote workforce housing remains necessary in energy, mining, infrastructure, and industrial projects where local accommodation is limited. Government-related temporary housing is also a structural need, especially when agencies require ready-to-use facilities and outsourced operational support. These are not glamorous markets, but they can be durable when execution and contract positioning are strong.
The company’s strategy is logical for future expansion because it is built around existing assets, specialized operating know-how, and turnkey service capability. That matters in markets where customers want speed, compliance, and reliable on-site services rather than just empty buildings. If demand improves, the company can often expand returns by lifting occupancy at existing communities instead of relying only on major new construction.
Revenue growth has been uneven. After exceptionally strong expansion in 2022 and early 2023, the company went through a prolonged contraction, then returned to positive growth more recently, including a strong rebound by mid-2026. That suggests growth is real but not smooth; it tends to arrive in waves tied to contract timing and site utilization rather than broad-based steady compounding.
Cash generation tells a similar story. Free cash flow was very strong during the peak period, then faded sharply and even turned slightly negative more recently. For long-term analysis, this matters because Target Hospitality’s appeal depends heavily on its ability to convert contract revenue into cash after maintenance and investment needs. A sustained recovery in cash flow would be a more convincing sign of renewed business strength than revenue growth alone.
A meaningful catalyst is the company’s exposure to large government housing programs and to energy-related activity in key U.S. basins. If contract volumes expand under current or newly awarded agreements, earnings can recover quickly because much of the operating platform is already in place. Another positive element is the company’s very low leverage, which gives it flexibility to support operations, repurchase shares, pursue selective expansion, or withstand uneven demand better than a heavily indebted competitor.
Recent market performance suggests investors are reacting to the possibility of improving fundamentals. The stock has risen strongly over the last 6 to 12 months, far ahead of the sector median, which usually means the market is anticipating better utilization, improved contract visibility, or a rebound in earnings after the difficult 2025 period.
Risks
This article is for informational purposes only and does not constitute financial advice. Some content is AI-generated. See Disclaimer