Stock Analysis · Target Corporation (TGT)
Overview
Target Corporation is one of the largest mass-merchandise retailers in the United States. The company sells everyday essentials, food and beverages, beauty products, apparel, home goods, electronics, toys, seasonal items, and other general merchandise through a nationwide store network and digital channels. Its business model is built around large-format stores that also support online order pickup, same-day delivery, and shipping, which makes the physical store base a central part of both in-store and e-commerce sales.
Target reports revenue mainly as merchandise sales, with a smaller contribution from other sources such as advertising, credit card profit-sharing, and marketplace-related or service income. Based on the company’s recent annual reporting, the revenue mix is approximately:
- Merchandise sales: about 98% to 99% — sales across Target’s core categories, including beauty and household essentials, food and beverage, hardlines, home furnishings and décor, apparel and accessories.
- Other revenue: about 1% to 2% — includes services and other income streams tied to the retail ecosystem, such as its Roundel advertising business and profit-sharing arrangements connected to Target-branded credit card activity.
Within merchandise, Target’s sales mix has historically been led by frequency categories that bring customers into stores more often, especially beauty and household essentials and food and beverage, followed by hardlines, home furnishings and décor, and apparel and accessories. This mix matters because staple categories tend to be more resilient, while discretionary categories can be more sensitive to consumer spending swings.
The company’s recent financial structure shows a business with very large revenue, but tighter profitability than a few years ago. Sales have remained above $100 billion annually, while gross profit and net income recovered from the sharp 2022 margin shock but have not returned to earlier peaks. Operating expenses, especially selling and administrative costs, have also been rising, which helps explain why earnings recovery has been incomplete.
The broad pattern is stable scale with pressured margins: revenue has eased modestly from the post-pandemic highs, cost of goods has come down, but expense growth has limited the rebound in profits.
Key Figures
| Metric | Value | Sector ⓘ |
|---|---|---|
| Date | Oct 17, 2026 | |
| Context | ||
| Sector | Consumer Defensive | |
| Industry | Discount Stores | |
| Market Cap ⓘ | $69.79B | |
| Beta ⓘ | 0.98 | |
Value (Cheapness) | ||
| P/E Ratio ⓘ | 15.95 | 17.88 |
| P/B Ratio ⓘ | 3.89 | 1.29 |
| FCF Yield ⓘ | 6.52% | 12.39% |
| Dividend Yield ⓘ | 2.97% | 2.85% |
| EBIT / EV ⓘ | 7.12% | 6.43% |
| PEG ⓘ | 1.98 | |
Growth (Business expansion) | ||
| Revenue Growth ⓘ | 5.30% | 4.10% |
| RPS Growth (5Y CAGR) ⓘ | 1.68% | 6.18% |
| EPS Growth (5Y CAGR) ⓘ | -9.93% | -13.59% |
| BVPS Growth (5Y CAGR) ⓘ | 8.05% | 3.20% |
| Margin Growth (5Y Trend) ⓘ | -3.83% | -0.15% |
| FCF Growth (5Y CAGR) ⓘ | -13.57% | 4.10% |
| DPS Growth (5Y CAGR) ⓘ | 9.43% | 6.79% |
Quality (Business durability) | ||
| ROIC (Latest) ⓘ | 14.58% | 12.34% |
| ROA (Latest) ⓘ | 7.25% | 6.30% |
| ROIC (5Y Median) ⓘ | 14.68% | 10.49% |
| ROA (5Y Median) ⓘ | 7.23% | 5.44% |
| Net Debt / EBIT (Latest) ⓘ | 2.18 | 1.96 |
| Net Debt / EBIT (5Y Median) ⓘ | 2.73 | 2.35 |
| Net Debt / EBITDA (Latest) ⓘ | 1.44 | 1.38 |
| Net Debt / Assets ⓘ | 21.70% | 21.51% |
| EBITDA / Interest ⓘ | 21.59 | 9.46 |
| Operating Margin (Latest) ⓘ | 5.65% | 8.87% |
| Operating Margin (5Y Median) ⓘ | 5.32% | 9.53% |
| Debt to Equity (Latest) ⓘ | 104.81% | 72.35% |
| Profit Margin (Latest) ⓘ | 4.08% | 5.40% |
| Free Cash Flow (Latest) ⓘ | $4.55B | |
Momentum (Price trend) | ||
| 3Y Return ⓘ | +51.51% | +20.92% |
| 12M Return (excl. last month) ⓘ | +80.26% | +2.13% |
| 6M Return ⓘ | +31.15% | +1.26% |
| Price vs. 200-Day MA ⓘ | +17.48% | +1.39% |
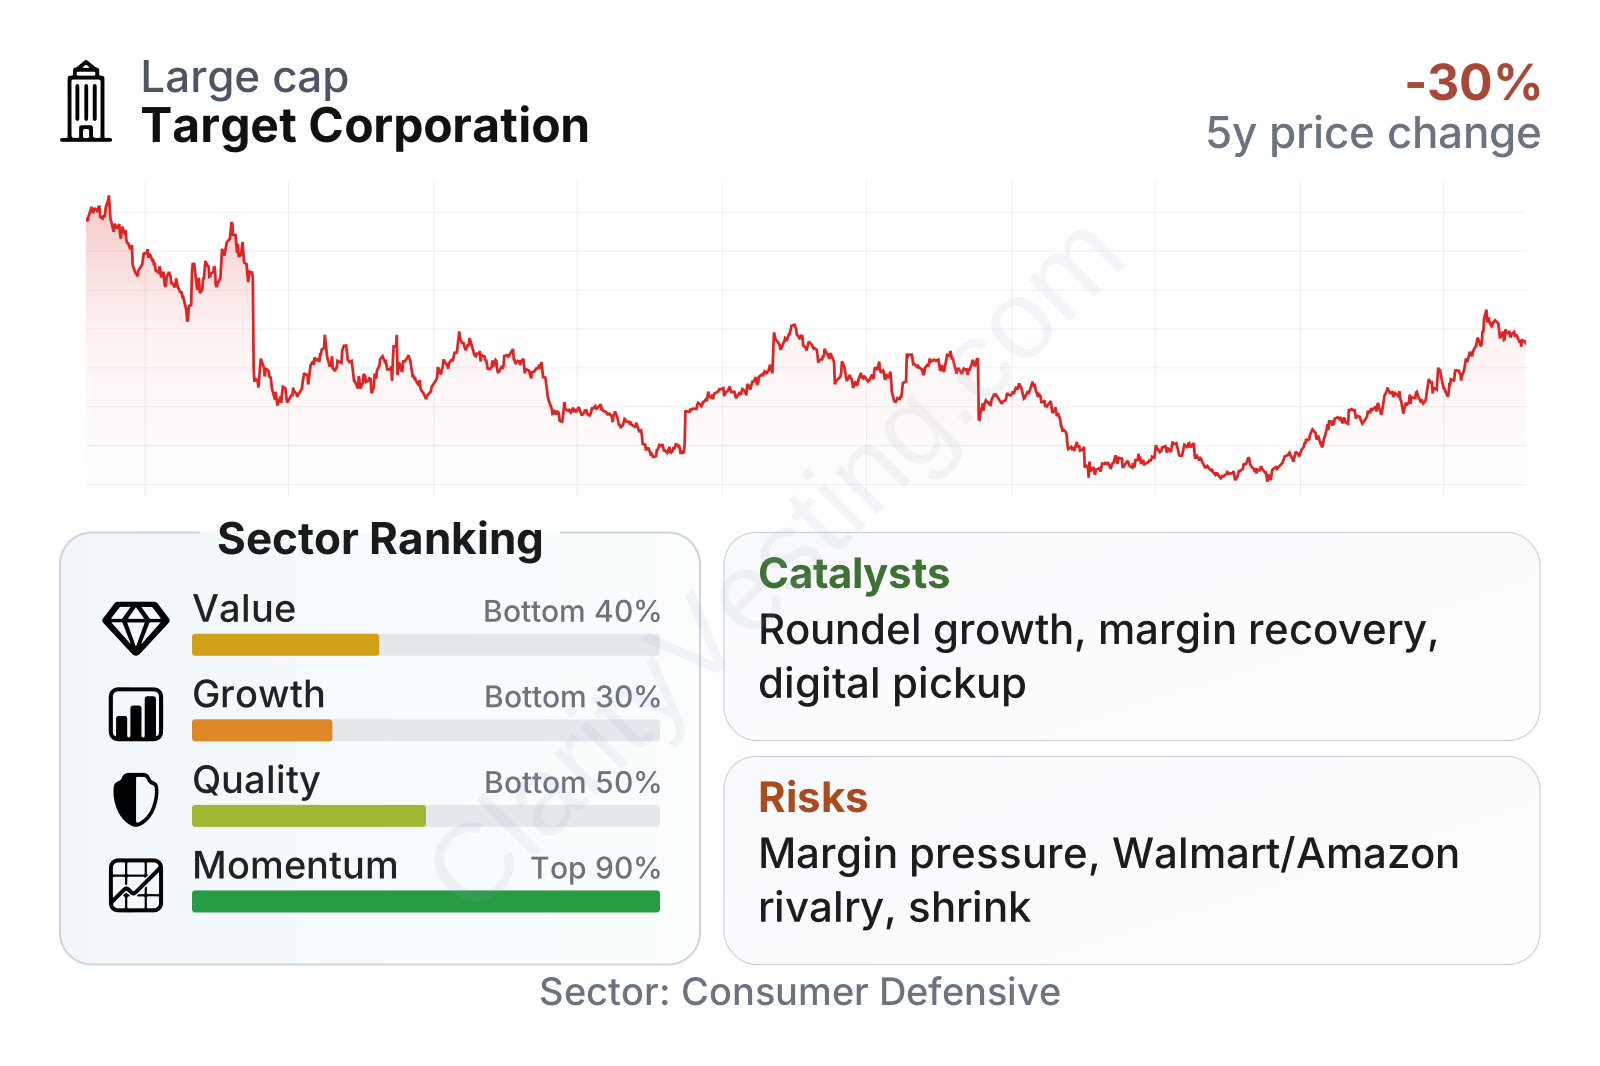
Target is a large consumer defensive company with share-price momentum that has recently been much stronger than the sector. At the same time, the factor profile is mixed. Growth and valuation rank in the lower end of the sector, while quality is around the middle-to-lower range. The main reason is that recent revenue growth has improved, but longer-term sales expansion, free cash flow growth, and margin trends have been weaker than many sector peers. The company still generates meaningful cash flow and maintains a dividend yield roughly in line with the sector, but leverage and profitability remain important watchpoints.
Growth
Target operates in a sector that is mature rather than fast-growing, but it is still relevant for long-term expansion because demand for essentials, value-oriented shopping, and convenience tends to persist across economic cycles. The bigger question is not whether discount retail has a future, but which retailers can capture spending as shopping habits keep shifting between stores, pickup, delivery, and digital search. On that front, Target’s strategy is sensible: it uses stores as fulfillment hubs, bundles convenience options into one ecosystem, and keeps investing in owned brands, loyalty tools, and retail media.
A major growth driver is the company’s ability to increase customer frequency in staple categories while rebuilding discretionary categories such as home and apparel. Another potential catalyst is Roundel, Target’s advertising business, which benefits from the company’s shopper data and tends to carry better margins than product sales. If that business keeps scaling, it could support earnings growth even if overall retail sales stay moderate.
Revenue growth has been uneven over the last several years. After strong post-pandemic gains, Target went through a long stretch of flat or negative year-over-year comparisons. More recently, sales growth turned positive again, with recent readings in the mid-single-digit range and slightly ahead of the sector median. That is encouraging, but it does not yet erase the broader pattern of low growth over a five-year view.
Cash generation tells a similar story. Free cash flow fell sharply during the inventory disruption period, then recovered, though it has remained volatile. Even after the rebound, the longer-term trend is still weaker than many peers. For long-term business growth, the most important point is whether Target can convert stabilizing sales into steadier cash generation without giving up too much on pricing, promotions, or fulfillment costs.
Recent company updates have also highlighted continued investments in stores, supply chain capabilities, same-day services, and third-party digital marketplace features. These moves are not dramatic on their own, but together they show an effort to make Target more competitive in convenience, product discovery, and vendor reach. In a slow-growth sector, execution improvements like these can matter more than headline industry growth.
Risks
This article is for informational purposes only and does not constitute financial advice. Some content is AI-generated. See Disclaimer


