Stock Analysis · TGS NOPEC Geophysical Company ASA (TGSGY)
Overview
TGS NOPEC Geophysical Company ASA is an energy data and services company focused on helping oil and gas producers decide where to explore, how to evaluate reservoirs, and how to operate offshore assets more efficiently. In simple terms, it gathers, processes, and sells subsurface information such as seismic surveys, well data, and related interpretation products. Over time, the business has expanded from a mainly data-library model into a broader energy-services platform that also includes acquisition and imaging work, with a particularly strong footprint in offshore markets.
The company’s revenue mix changed meaningfully after its combination with PGS. Based on recent annual reporting, the largest sources of revenue now come from marine contract work and multi-client data sales, with smaller contributions from data licensing, imaging, and other geoscience services. Approximate revenue sources, from largest to smallest, are as follows:
- Contract acquisition services: about 45% to 55% of revenue. This includes vessel-based seismic acquisition performed for individual customers under contract.
- Multi-client data sales: about 25% to 35%. This is the sale of access to seismic libraries that TGS has built in advance and can license to multiple customers.
- Imaging, processing, and other data services: about 10% to 20%. This includes turning raw survey data into usable subsurface images and related interpretation support.
- New-energy and adjacent offerings: currently a small share of revenue. These activities include offshore wind site data and carbon storage-related subsurface work, but they are not yet a major earnings driver.
This business model matters for long-term analysis because multi-client libraries can be highly profitable when customer demand is strong, while contract acquisition adds scale but tends to carry lower margins and more operational complexity. The result is a company with useful recurring data assets, but also with more exposure to vessel utilization, project timing, and offshore spending cycles than in the past.
The long-term picture shows a company that has become much larger in revenue, especially after the merger, but earnings conversion has been uneven. Revenue has climbed sharply since 2021, while interest costs rose and net income remained far more volatile than sales.
Key Figures
| Metric | Value | Sector ⓘ |
|---|---|---|
| Date | Oct 10, 2026 | |
| Context | ||
| Sector | Energy | |
| Industry | Oil & Gas Equipment & Services | |
| Market Cap ⓘ | $2.81B | |
| Beta ⓘ | -0.06 | |
Value (Cheapness) | ||
| P/E Ratio ⓘ | 29.81 | 14.91 |
| P/B Ratio ⓘ | 1.44 | 1.67 |
| FCF Yield ⓘ | 6.54% | 8.53% |
| Dividend Yield ⓘ | 4.40% | 3.63% |
| EBIT / EV ⓘ | 2.49% | 7.44% |
| PEG ⓘ | N/A | |
Growth (Business expansion) | ||
| Revenue Growth ⓘ | 11.60% | 27.10% |
| RPS Growth (5Y CAGR) ⓘ | 15.00% | 6.85% |
| EPS Growth (5Y CAGR) ⓘ | N/A | -15.33% |
| BVPS Growth (5Y CAGR) ⓘ | 1.35% | 6.02% |
| Margin Growth (5Y Trend) ⓘ | -27.44% | 0.64% |
| FCF Growth (5Y CAGR) ⓘ | 30.17% | 3.59% |
| DPS Growth (5Y CAGR) ⓘ | 2.50% | 16.79% |
Quality (Business durability) | ||
| ROIC (Latest) ⓘ | 2.77% | 11.33% |
| ROA (Latest) ⓘ | -0.63% | 6.03% |
| ROIC (5Y Median) ⓘ | 6.92% | 10.19% |
| ROA (5Y Median) ⓘ | 1.14% | 5.40% |
| Net Debt / EBIT (Latest) ⓘ | 5.55 | 1.60 |
| Net Debt / EBIT (5Y Median) ⓘ | -0.29 | 1.91 |
| Net Debt / EBITDA (Latest) ⓘ | 0.74 | 1.05 |
| Net Debt / Assets ⓘ | 13.33% | 17.29% |
| EBITDA / Interest ⓘ | 9.17 | 9.65 |
| Operating Margin (Latest) ⓘ | 7.33% | 16.21% |
| Operating Margin (5Y Median) ⓘ | 13.89% | 19.99% |
| Debt to Equity (Latest) ⓘ | N/A | 54.41% |
| Profit Margin (Latest) ⓘ | 7.20% | 8.79% |
| Free Cash Flow (Latest) ⓘ | $183.90M | |
Momentum (Price trend) | ||
| 3Y Return ⓘ | +35.11% | +70.76% |
| 12M Return (excl. last month) ⓘ | +101.04% | +46.44% |
| 6M Return ⓘ | +9.83% | +0.36% |
| Price vs. 200-Day MA ⓘ | +8.52% | +8.00% |
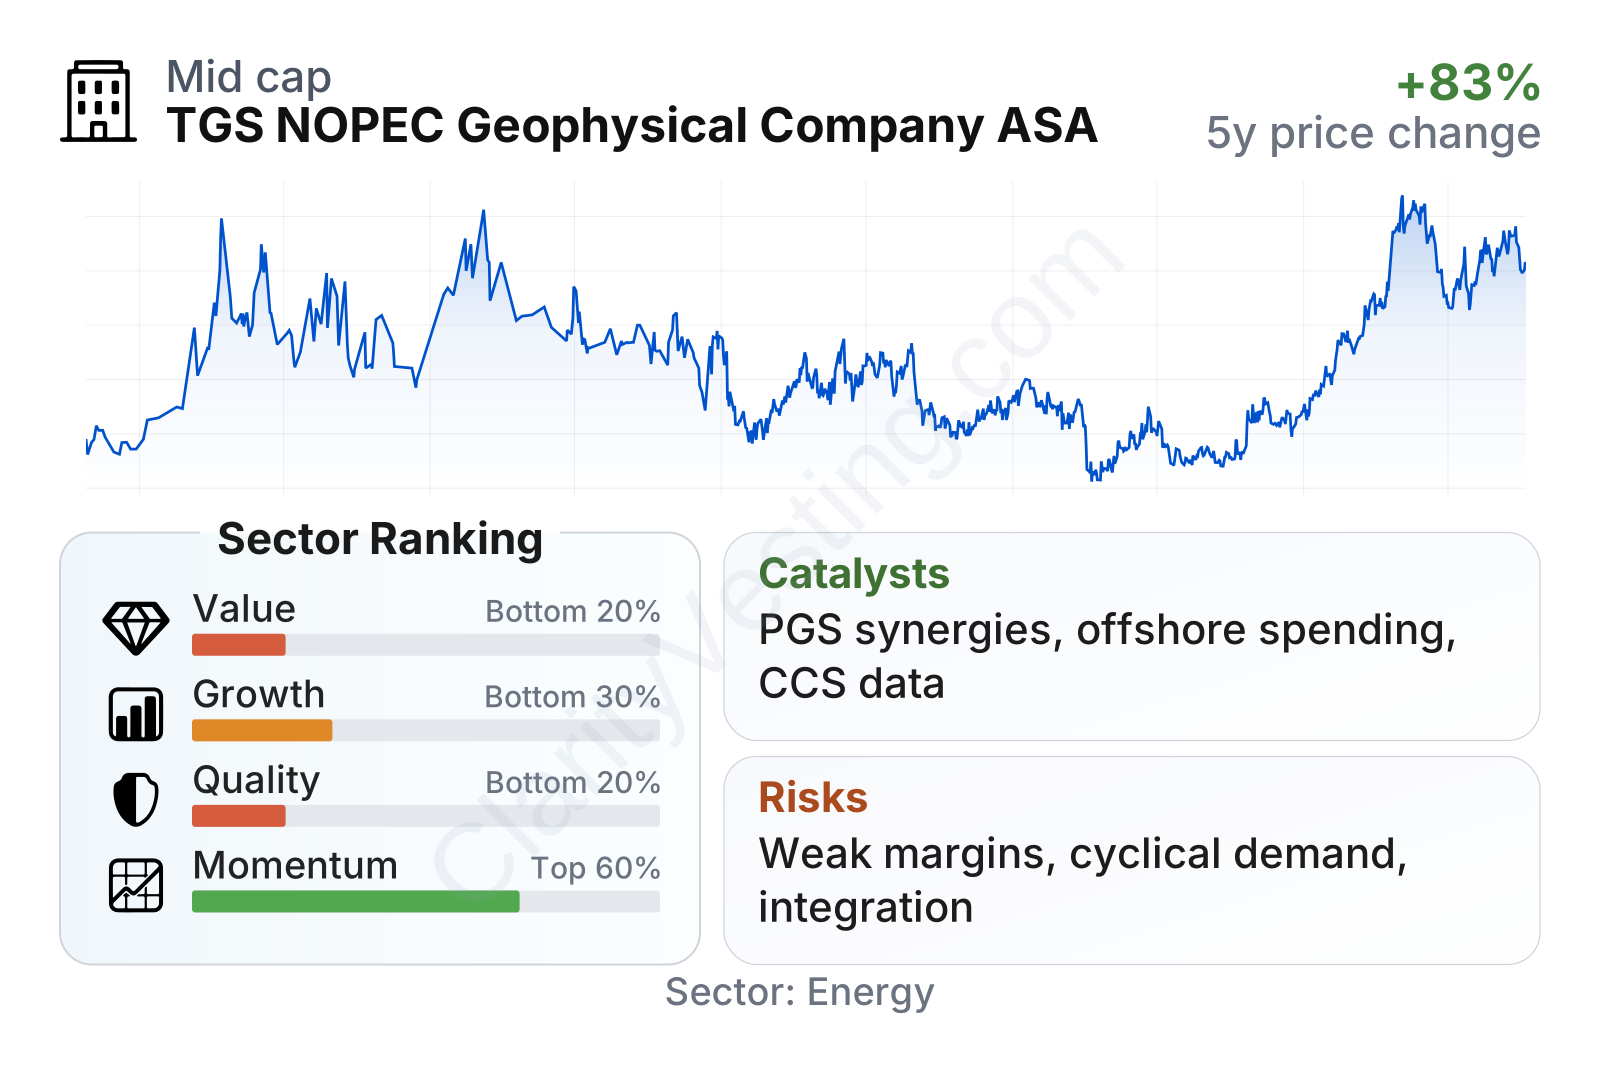
TGS is now a mid-sized energy-services company by market value. The table suggests a mixed profile: valuation metrics look weaker than much of the sector, growth is uneven in the short run despite a solid five-year revenue-per-share trend, and profitability measures remain below typical industry levels. On the positive side, recent price momentum has improved, free cash flow generation has been meaningful, and the dividend yield is slightly above the sector median.
The stock chart also highlights how cyclical sentiment can be. After notable weakness through parts of 2024 and 2025, the shares rebounded strongly into 2026, showing that the market is reacting to improving expectations around integration, offshore activity, and earnings recovery.
Growth
TGS operates in a sector that still depends heavily on global oil and gas spending, but the more specific niche is offshore subsurface data and seismic services. That niche remains relevant because major producers continue to need new reserves, and offshore projects often require large amounts of geological information before companies commit billions of dollars to development. In that sense, TGS is tied less to short-term fuel demand alone and more to the ongoing need to replace reserves and improve drilling success.
The company’s strategy for future growth is logical. It combines a valuable geoscience data library with physical acquisition capacity, which allows TGS to offer customers both data products and field services. That broader platform can deepen customer relationships and create cross-selling opportunities. The merger with PGS also increased scale, vessel access, and exposure to active offshore basins, which could support better market positioning if integration is executed well.
Recent revenue growth has been strong in headline terms, but it has also been volatile from quarter to quarter. That is normal for a project-driven business, yet it also means growth should not be read as a smooth upward line. The stronger periods reflect both merger effects and a healthier offshore market, while weaker periods show how quickly timing differences can affect reported results.
Cash generation is one of the more encouraging points. Free cash flow has fluctuated, but the broader trend shows TGS can convert its business into real cash when project activity and library sales line up well. That matters because free cash flow supports debt reduction, shareholder distributions, and continued investment in new surveys without depending entirely on external funding.
A meaningful catalyst is the company’s exposure to offshore exploration and production budgets, especially in regions where major discoveries or licensing rounds encourage new seismic work. Another catalyst is the possibility of extracting more value from the combined TGS-PGS platform through cost synergies, better vessel utilization, and stronger pricing across marine data services. In addition, carbon storage and offshore wind site characterization offer a long-term adjacent opportunity, even though these businesses are still small compared with the core oil and gas franchise.
Risks
This article is for informational purposes only and does not constitute financial advice. Some content is AI-generated. See Disclaimer


