Stock Analysis · 3i Group PLC (TGOPY)
Overview
3i Group PLC is a British investment company focused on private equity, infrastructure, and a smaller investment portfolio. Rather than producing goods or selling consumer services directly, it allocates capital into businesses and projects, then aims to increase their value over time through operational improvement, expansion, and disciplined exits. For U.S. readers using the TGOPY ticker, the underlying business is essentially a listed alternative asset manager and investor with a particularly strong emphasis on long-term ownership.
Its economics are a little different from a traditional asset manager. A large part of reported performance comes from changes in the value of its investments, realized gains when assets are sold, and recurring income such as dividends, interest, and management fees from certain activities. In recent years, one holding has stood out clearly: Action, the European discount retailer, has been the most important value driver in the private equity portfolio.
Based on the latest annual reporting, the investment portfolio is concentrated in a few main areas:
- Private equity: about 80% to 85% of portfolio value. This includes 3i’s ownership stakes in businesses, with Action representing the largest single asset by far.
- Infrastructure: about 10% to 15% of portfolio value. This segment includes long-duration assets and platforms, typically with more stable cash generation than private equity.
- Scandlines and other smaller investments / cash / other items: the remainder. These include legacy assets, smaller holdings, and balance sheet resources.
That mix matters because 3i is not broadly diversified like a giant traditional fund manager. It is closer to a concentrated investment vehicle whose returns are heavily influenced by the underlying progress and valuation of a relatively small number of major holdings.
Recent financial flow trends also show how unusual the model can look from year to year: reported revenue can swing sharply, while net income remains very high because fair-value gains on investments dominate accounting profit. That makes 3i better understood through portfolio value growth, net asset value progression, and realized cash generation than through ordinary sales trends alone.
The business has shown very low direct operating costs relative to the value created in stronger years, but accounting results are heavily shaped by investment revaluations rather than steady operating revenue.
Key Figures
| Metric | Value | Sector ⓘ |
|---|---|---|
| Date | Oct 24, 2026 | |
| Context | ||
| Sector | Financial Services | |
| Industry | Asset Management | |
| Market Cap ⓘ | $31.08B | |
| Beta ⓘ | 1.14 | |
Value (Cheapness) | ||
| P/E Ratio ⓘ | 4.25 | 12.46 |
| P/B Ratio ⓘ | 1.02 | 1.25 |
| FCF Yield ⓘ | 2.88% | 9.82% |
| Dividend Yield ⓘ | 3.64% | 2.94% |
| EBIT / EV ⓘ | N/A | 8.11% |
| PEG ⓘ | N/A | |
Growth (Business expansion) | ||
| Revenue Growth ⓘ | -33.40% | 9.10% |
| RPS Growth (5Y CAGR) ⓘ | -25.98% | 12.31% |
| EPS Growth (5Y CAGR) ⓘ | N/A | -6.97% |
| BVPS Growth (5Y CAGR) ⓘ | 4.52% | 5.02% |
| Margin Growth (5Y Trend) ⓘ | -467.79% | -4.00% |
| FCF Growth (5Y CAGR) ⓘ | -25.82% | 4.71% |
| DPS Growth (5Y CAGR) ⓘ | -0.78% | 8.92% |
Quality (Business durability) | ||
| ROIC (Latest) ⓘ | N/A | 9.18% |
| ROE (Latest) ⓘ | 39.23% | 13.93% |
| ROA (Latest) ⓘ | 37.22% | 1.57% |
| ROIC (5Y Median) ⓘ | 25.35% | 7.80% |
| ROE (5Y Median) ⓘ | 22.50% | 12.15% |
| ROA (5Y Median) ⓘ | 21.13% | 1.28% |
| Net Debt / EBIT (Latest) ⓘ | N/A | 1.02 |
| Net Debt / EBIT (5Y Median) ⓘ | 0.15 | 0.72 |
| Net Debt / EBITDA (Latest) ⓘ | 0.06 | 0.88 |
| Operating Margin (Latest) ⓘ | N/A | 22.30% |
| Operating Margin (5Y Median) ⓘ | 329.61% | 24.50% |
| Debt to Equity (Latest) ⓘ | 4.08% | 59.34% |
| Profit Margin (Latest) ⓘ | 94.84% | 26.42% |
| Free Cash Flow (Latest) ⓘ | $894.90M | |
Momentum (Price trend) | ||
| 3Y Return ⓘ | +34.55% | +95.73% |
| 12M Return (excl. last month) ⓘ | -29.94% | +17.30% |
| 6M Return ⓘ | -15.54% | +6.07% |
| Price vs. 200-Day MA ⓘ | -14.76% | +5.36% |
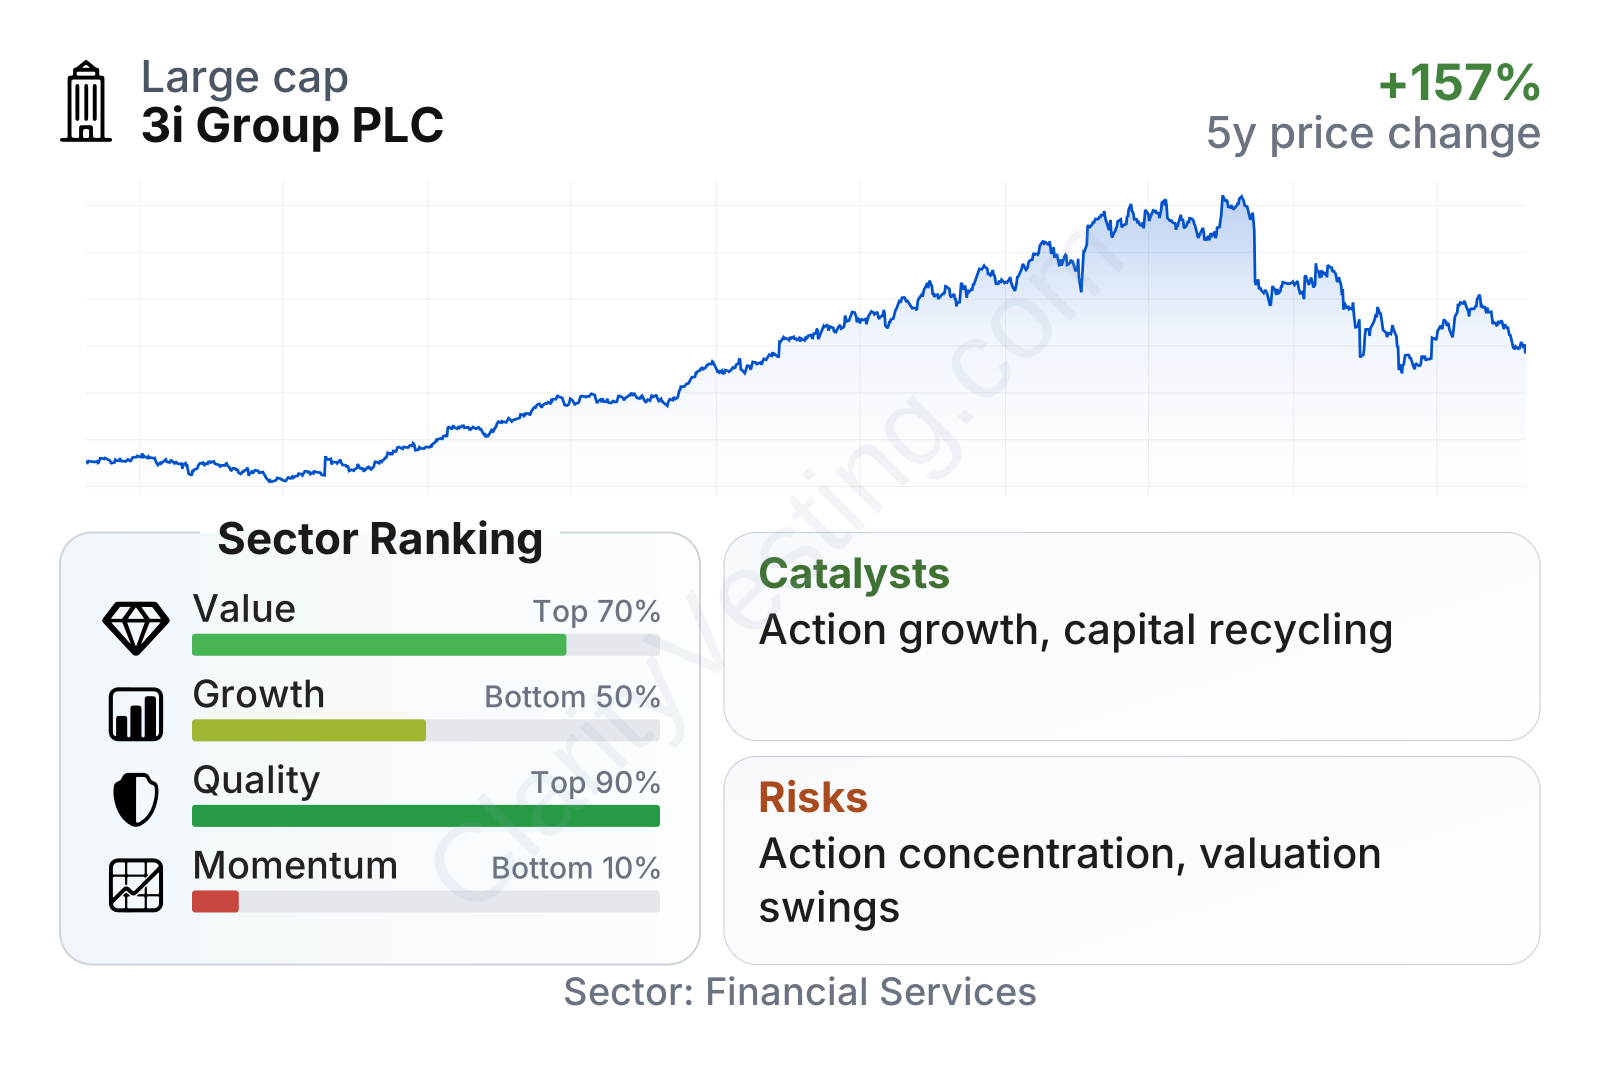
3i Group is a large listed alternative investment firm with a market value in the tens of billions of dollars, so it is not a niche micro-cap. The table points to a mixed profile: quality is very strong versus the broader financial sector, while growth and momentum look weaker on recent screens. The valuation metrics appear modest, with earnings and book-based multiples below or around sector norms, but those figures need to be read carefully because profits in this business can be unusually affected by periodic revaluations. The balance sheet stands out positively, with very low leverage and solid free cash flow generation, while the dividend yield is slightly above the sector median.
Growth
3i operates in a part of finance that still has long-term room to expand. Private equity and infrastructure continue to attract capital because many institutions want access to assets outside public stock markets, and infrastructure remains supported by long-duration themes such as energy transition, digital networks, transportation, and essential services. That said, 3i’s growth path is less about gathering fees at very large scale, as firms like Blackstone or KKR do, and more about compounding value within a concentrated portfolio.
The company’s strategy makes sense if management can keep doing three things well: identify strong assets, support operational growth at portfolio companies, and avoid overpaying when making new investments. The biggest proof point so far has been Action. The retailer has expanded rapidly across Europe and has become the main engine behind 3i’s net asset value growth. As long as Action keeps opening stores, maintaining customer traffic, and defending margins, 3i has a powerful built-in catalyst.
Earnings per share have been lumpy rather than smooth, which is normal for an investment group whose reported profit depends heavily on valuation gains and exits. That makes one-off jumps less informative than the broader direction of asset value creation over a full cycle.
Book value per share has been the cleaner measure to watch because it tracks the value built inside the portfolio. Over several years, that measure climbed strongly before a recent drop, showing both the compounding potential of the model and the sensitivity to valuation marks. For a company like 3i, long-term growth depends less on linear revenue expansion and more on whether book value can keep trending upward across multiple years.
A meaningful recent opportunity is the company’s continued ability to recycle capital from mature assets into new investments while still benefiting from the growth of existing core holdings. In addition, infrastructure remains an attractive area for long-duration capital, which could support more balanced growth over time if 3i expands that segment selectively.
Risks
This article is for informational purposes only and does not constitute financial advice. Some content is AI-generated. See Disclaimer


