Stock Analysis · 3i Group plc (TGOPF)
Overview
3i Group plc is a UK-listed investment company focused mainly on private equity. In simple terms, it buys and builds businesses, helps them grow, and then benefits from the increase in their value over time. The group also has an infrastructure investment arm and a smaller role as an investment manager for third-party capital, but the business is dominated by returns from its own investment portfolio rather than by traditional management fees alone.
Its economic engine is unusually concentrated. Based on the latest annual reporting for the year ended March 31, 2026, the biggest contributor to portfolio value and performance is Action, the non-food discount retailer operating across Europe. 3i’s results are driven primarily by fair value gains, dividend income, and realized proceeds from private equity and infrastructure holdings. That makes reported revenue and earnings more volatile than those of a conventional asset manager, because gains depend heavily on changes in portfolio valuations and exits.
The main sources of value creation can be summarized as follows.
- Private Equity: the clear core of the group, representing the vast majority of net asset value and profit generation. This includes Action as the dominant asset, along with a portfolio of other mid-market businesses.
- Infrastructure: a much smaller segment, built around long-duration assets and funds. It adds diversification but is not the main driver of group results.
- Other income and cash returns: dividends from portfolio companies, investment income, and proceeds from exits. These support cash generation and shareholder distributions.
Because 3i reports as an investment company, precise revenue mix percentages are less straightforward than in an operating business. However, public reporting makes clear that Private Equity accounts for well above 80% of the group’s portfolio value, with Infrastructure making up most of the remainder. Within Private Equity, Action is by far the single most important asset and has represented more than 50% of the private equity portfolio in recent reporting.
The group’s cost structure is also light for a business of this size. Over recent years, operating profit has stayed very close to gross profit, which reflects the economics of an investment company: a small expense base can support very large investment gains when portfolio companies perform well.
The profit flow over the last several years shows a business with very limited operating costs relative to the value created in the portfolio. That efficiency is attractive, but it also underlines an important point: results depend far more on asset valuations and portfolio performance than on recurring operating revenue in the usual sense.
Key Figures
| Metric | Value | Sector ⓘ |
|---|---|---|
| Date | Oct 17, 2026 | |
| Context | ||
| Sector | Financial Services | |
| Industry | Asset Management | |
| Market Cap ⓘ | $32.55B | |
| Beta ⓘ | 1.14 | |
Value (Cheapness) | ||
| P/E Ratio ⓘ | 4.44 | 12.26 |
| P/B Ratio ⓘ | 1.07 | 1.23 |
| FCF Yield ⓘ | 2.74% | 10.40% |
| Dividend Yield ⓘ | 3.52% | 3.02% |
| EBIT / EV ⓘ | N/A | 8.14% |
| PEG ⓘ | N/A | |
Growth (Business expansion) | ||
| Revenue Growth ⓘ | -33.40% | 9.35% |
| RPS Growth (5Y CAGR) ⓘ | -47.34% | 12.19% |
| EPS Growth (5Y CAGR) ⓘ | -3.58% | -9.53% |
| BVPS Growth (5Y CAGR) ⓘ | 15.99% | 4.99% |
| Margin Growth (5Y Trend) ⓘ | 1155.16% | -3.86% |
| FCF Growth (5Y CAGR) ⓘ | -26.44% | 4.81% |
| DPS Growth (5Y CAGR) ⓘ | 10.10% | 8.79% |
Quality (Business durability) | ||
| ROIC (Latest) ⓘ | N/A | 9.49% |
| ROE (Latest) ⓘ | 39.10% | 13.90% |
| ROA (Latest) ⓘ | 37.10% | 1.55% |
| ROIC (5Y Median) ⓘ | 21.36% | 7.86% |
| ROE (5Y Median) ⓘ | 22.50% | 12.17% |
| ROA (5Y Median) ⓘ | 21.13% | 1.30% |
| Net Debt / EBIT (Latest) ⓘ | N/A | 0.96 |
| Net Debt / EBIT (5Y Median) ⓘ | 0.16 | 0.73 |
| Net Debt / EBITDA (Latest) ⓘ | 0.06 | 0.92 |
| Operating Margin (Latest) ⓘ | N/A | 22.30% |
| Operating Margin (5Y Median) ⓘ | 96.71% | 24.63% |
| Debt to Equity (Latest) ⓘ | 4.08% | 58.56% |
| Profit Margin (Latest) ⓘ | 94.84% | 26.57% |
| Free Cash Flow (Latest) ⓘ | $893.32M | |
Momentum (Price trend) | ||
| 3Y Return ⓘ | +39.62% | +88.33% |
| 12M Return (excl. last month) ⓘ | -30.37% | +19.38% |
| 6M Return ⓘ | -14.28% | +4.75% |
| Price vs. 200-Day MA ⓘ | -11.66% | +3.50% |
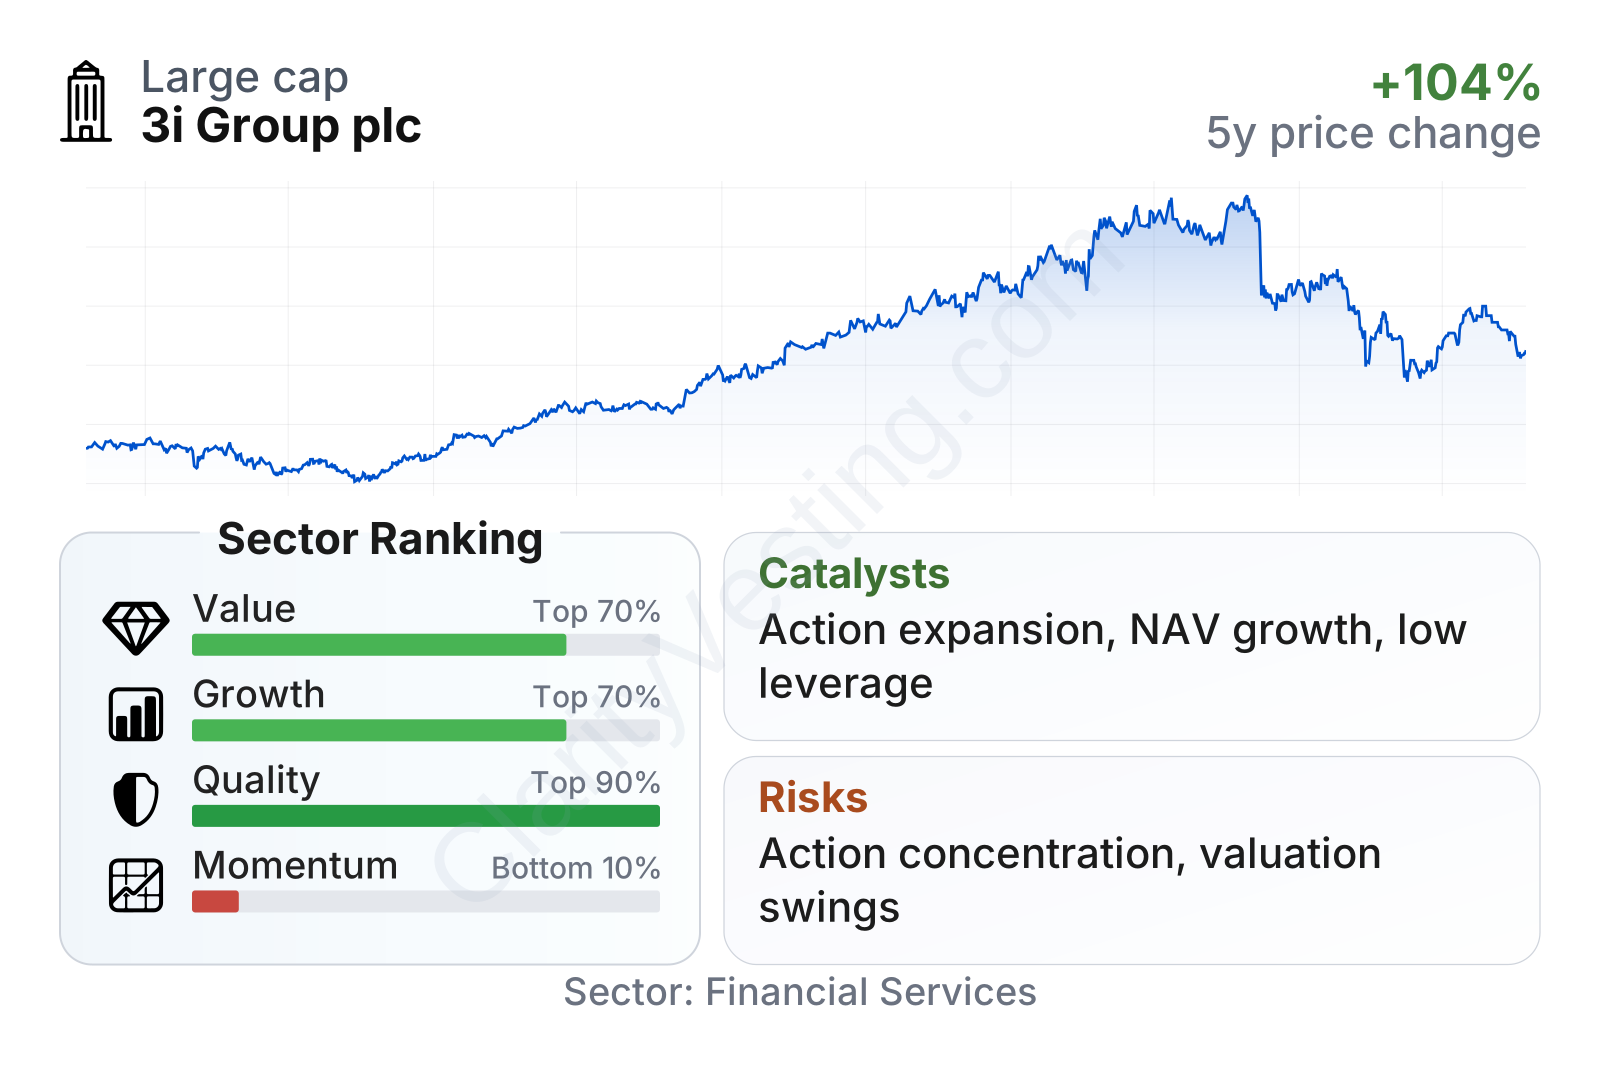
3i is a large alternative investment group with a market value in the tens of billions of dollars and share-price volatility that is moderately above the broader market. On valuation, its headline earnings multiple and price-to-book ratio currently sit around or below sector norms in the latest snapshot, which looks modest on the surface. Quality is where the business stands out most clearly: profitability, returns on equity, returns on assets, and balance-sheet strength all rank very strongly versus much of the financial sector. Growth indicators are more mixed because accounting revenue and cash flow can swing sharply from year to year in an investment business, even while book value and long-term intrinsic value continue to compound. Momentum has been weaker than many sector peers after a sharp rerating and later pullback.
Growth
3i operates in a part of financial services that still has a meaningful long-term runway. Private equity and infrastructure both benefit from structural demand for private capital, operational improvement, and international expansion of portfolio companies. Within that landscape, 3i’s strategy is distinctive because it is not trying to be the broadest platform in the industry. Instead, it has become highly focused on owning a limited number of assets where it believes it can support operational growth over many years.
The strongest growth catalyst remains Action. The retailer continues to expand its store base across Europe, and its discount positioning can remain relevant in both weak and stronger consumer environments. For 3i, that matters because Action is not just another holding; it is the central asset behind a large share of net asset value growth in recent years. As long as store rollout, customer traffic, and earnings expansion remain healthy, 3i has a powerful internal engine for compounding value.
Book value growth has been one of the clearest signs of long-term progress. Even with a recent dip from the prior year, book value per share has risen strongly over the last five years, far ahead of many financial peers. That matters more here than revenue growth alone, because book value better reflects the accumulation of investment gains inside the portfolio.
The pattern in book value per share points to substantial value creation over time, even though annual moves can be uneven. For an investment company, that is often a more useful signal than reported sales.
Earnings per share can be more difficult to interpret in a business like 3i because unrealized valuation changes can produce large jumps or drops between years. Even so, long-term earnings power is supported by recurring dividends from portfolio companies, selective exits, and the scaling of its strongest assets.
Another supportive factor is capital discipline. 3i has historically been selective on new deals and willing to let successful holdings run rather than sell too early. That approach can look less active than a traditional buyout model, but it fits the company’s recent record of value creation. Recent company updates have continued to emphasize portfolio resilience, Action’s development, and steady progress in Infrastructure, all of which support the case for further net asset value growth if execution remains strong.
Risks
This article is for informational purposes only and does not constitute financial advice. Some content is AI-generated. See Disclaimer


