Stock Analysis · Tetragon Financial Group Ltd (TGONF)
Overview
Tetragon Financial Group Ltd is a publicly traded alternative asset manager and investment company. In simple terms, it both owns investments on its own balance sheet and earns fees from managing money for clients. Its activities span credit, private equity, real estate, venture-related strategies, and other alternative investments, with operations supported by its investment manager, TFG Asset Management and affiliated managers.
The business is not as straightforward as a traditional bank or a plain-vanilla fund manager because reported results can move sharply with market values, exits, and portfolio realizations. That makes Tetragon closer to a listed alternative investment platform than to a conventional operating company with smooth quarterly sales.
Based on the company’s recent annual reporting, revenue and economic value are mainly tied to investment gains and management-related earnings. Exact line-by-line percentages can vary materially from year to year because fair value changes are a major component of results, but the broad mix can be described as follows:
- Investment income and unrealized gains/losses: typically the largest driver of reported results. This includes mark-to-market changes and realized gains across Tetragon’s investment portfolio.
- Management and incentive fees: fees earned through TFG Asset Management and affiliated platforms for managing third-party and proprietary capital.
- Interest income and distributions from portfolio assets: cash income from credit investments, funds, and other holdings.
- Other income sources: smaller contributions from specific portfolio companies, structured investments, and balance-sheet positioning.
Tetragon’s economic model matters more than any single revenue line: if assets under management expand, investment performance is solid, and portfolio companies grow, both fee income and net asset value can rise together. That combination is the central reason the company attracts attention despite its niche structure and limited scale compared with the largest alternative managers.
The income profile has been highly variable, with a loss in 2022 followed by a sharp rebound in 2023 and much stronger profitability in 2024 and 2025. Operating costs have remained relatively contained compared with the swings in total revenue, which shows how sensitive results are to investment gains rather than to a heavy fixed-cost operating base.
Key Figures
| Metric | Value | Sector ⓘ |
|---|---|---|
| Date | Oct 31, 2026 | |
| Context | ||
| Sector | Financial Services | |
| Industry | Asset Management | |
| Market Cap ⓘ | $1.29B | |
| Beta ⓘ | -0.16 | |
Value (Cheapness) | ||
| P/E Ratio ⓘ | 7.99 | 12.20 |
| P/B Ratio ⓘ | 0.37 | 1.26 |
| FCF Yield ⓘ | 0.24% | 9.87% |
| Dividend Yield ⓘ | 6.64% | 2.87% |
| EBIT / EV ⓘ | N/A | 8.17% |
| PEG ⓘ | N/A | |
Growth (Business expansion) | ||
| Revenue Growth ⓘ | 8.60% | 8.40% |
| RPS Growth (5Y CAGR) ⓘ | 17.04% | 12.31% |
| EPS Growth (5Y CAGR) ⓘ | 151.28% | -4.03% |
| BVPS Growth (5Y CAGR) ⓘ | 9.55% | 4.96% |
| Margin Growth (5Y Trend) ⓘ | 112.06% | -4.14% |
| FCF Growth (5Y CAGR) ⓘ | N/A | 4.70% |
| DPS Growth (5Y CAGR) ⓘ | 1.05% | 8.85% |
Quality (Business durability) | ||
| ROIC (Latest) ⓘ | N/A | 9.35% |
| ROE (Latest) ⓘ | -0.37% | 13.95% |
| ROA (Latest) ⓘ | -0.34% | 1.57% |
| ROIC (5Y Median) ⓘ | N/A | 7.78% |
| ROE (5Y Median) ⓘ | 11.74% | 12.12% |
| ROA (5Y Median) ⓘ | 10.56% | 1.28% |
| Net Debt / EBIT (Latest) ⓘ | N/A | 0.99 |
| Net Debt / EBIT (5Y Median) ⓘ | -0.04 | 0.73 |
| Net Debt / EBITDA (Latest) ⓘ | N/A | 0.79 |
| Operating Margin (Latest) ⓘ | N/A | 22.61% |
| Operating Margin (5Y Median) ⓘ | 166.99% | 24.52% |
| Debt to Equity (Latest) ⓘ | 7.37% | 58.76% |
| Profit Margin (Latest) ⓘ | 49.23% | 26.18% |
| Free Cash Flow (Latest) ⓘ | $3.10M | |
Momentum (Price trend) | ||
| 3Y Return ⓘ | +80.90% | +95.34% |
| 12M Return (excl. last month) ⓘ | -27.67% | +16.22% |
| 6M Return ⓘ | +15.70% | +7.41% |
| Price vs. 200-Day MA ⓘ | -1.92% | +5.48% |
Tetragon stands out for strong growth metrics and a deep discount on valuation multiples, especially on price-to-book. The table also shows a mixed quality picture: profitability over longer periods has been respectable, but the latest trailing return measures look weak or distorted, likely reflecting the timing effects that often affect investment companies. Momentum has also been softer than the broader financial sector after a strong run-up and pullback.
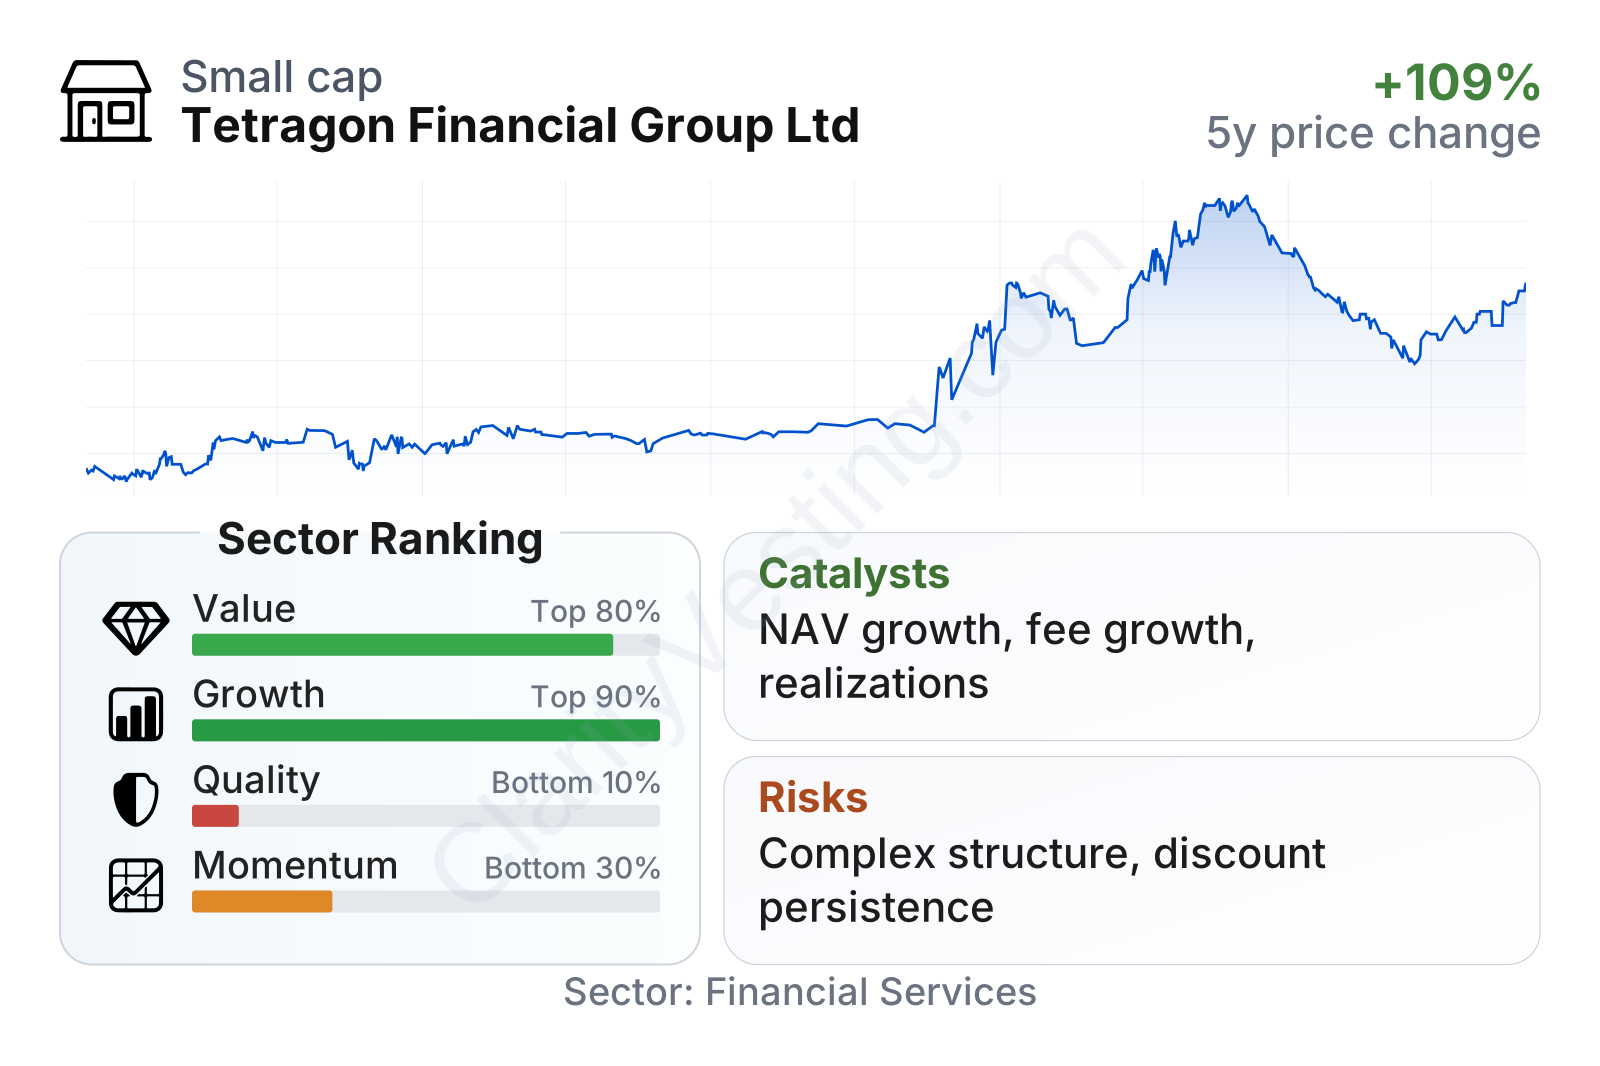
The stock has been volatile over the past few years. It moved from the high single digits to almost $19 before falling back into the mid-teens. That pattern fits a company whose market value is influenced not only by recurring fees, but also by changes in portfolio valuations, realized exits, and investor confidence in the reported net asset value.
Growth
Tetragon operates in a part of finance that still has long-term tailwinds. Alternative asset management has benefited from institutional demand for private credit, less traditional income strategies, and specialized investment expertise. Large pensions, insurers, and wealthy investors have continued shifting capital toward these areas, especially as public markets have become more crowded and more efficient.
Tetragon’s strategy makes sense if viewed through that lens. The company is trying to combine two engines: compounding book value through its own portfolio and building fee-generating asset management franchises. That is an appealing structure when it works well, because management fees can create steadier earnings while the balance sheet provides upside from successful investments and realizations.
The earnings trend shows why the company is being noticed. After weak readings in earlier periods, earnings per share improved sharply in 2024 and remained elevated into 2025. For a business like Tetragon, that kind of jump usually reflects a combination of stronger portfolio marks, realizations, and contributions from controlled or affiliated investment platforms rather than simple volume growth alone.
Book value per share has also moved steadily higher over the last several years, rising from roughly $29 in 2021 to above $41 by 2025. That is especially important for Tetragon because book value is one of the clearest ways to judge whether the company is creating economic value over time. A near 10% annualized increase over five years compares well with much of the broader financial sector.
A meaningful catalyst is the persistent gap between the share price and book value. If the company continues to grow net asset value, monetizes investments, and expands fee-related earnings, the market could eventually place a higher multiple on the shares. Another catalyst is any progress in scaling third-party assets under management, because recurring management fees tend to receive more favorable market treatment than volatile investment gains.
Recent corporate updates have also kept attention on capital allocation and asset management development. For Tetragon, news around realizations, share repurchases, portfolio exits, and fundraising across affiliated managers can matter more than conventional quarterly revenue headlines.
Risks
This article is for informational purposes only and does not constitute financial advice. Some content is AI-generated. See Disclaimer


