Stock Analysis · Teleflex Incorporated (TFX)
Overview
Teleflex Incorporated is a medical technology company that makes devices used mainly in hospitals and surgical settings. Its products are focused on areas where clinicians need precision, reliability, and regulatory approval, such as vascular access, anesthesia, interventional procedures, and urology. In simple terms, Teleflex sells tools that help doctors place catheters, manage airways, treat certain heart and blood vessel conditions, support surgery, and care for patients in critical settings.
The business is organized into product categories rather than one single flagship device, which helps reduce dependence on any one item. Based on the company’s recent annual reporting, revenue is led by vascular access and interventional products, with the remainder spread across anesthesia, surgical, and urology lines. Approximate revenue mix is as follows:
- Vascular Access – about 31%: central venous catheters, intraosseous access systems, PICCs, guidance tools, and related products used to gain access to the bloodstream.
- Interventional – about 22%: coronary and structural heart-related catheters, guidewires, and specialty devices, including products tied to Teleflex’s acquired cardiovascular portfolio.
- Anesthesia – about 13%: airway management and pain-control products used before, during, and after procedures.
- Surgical – about 13%: closure, ligation, stapling, and other operating room devices.
- Urology – about 12%: catheters, bladder management, and related products.
- OEM and Other – about 9%: components and smaller product categories sold to other manufacturers or into niche clinical uses.
Geographically, Teleflex generates the majority of sales in the United States, with the rest coming from Europe, Asia, and other international markets. That gives the company exposure to a broad healthcare base, but hospital procedure volumes and reimbursement conditions still matter a lot.
One notable recent trend is that sales have held up better than earnings. Revenue rose from roughly $2.8 billion in 2021 to just above $3.0 billion in 2024, while profitability weakened sharply in 2024 and the reported trailing results were pushed down further by charges that affected net income. That disconnect matters for long-term analysis because it suggests the core franchise still has demand, but cost pressure, portfolio changes, and one-time items have weighed on the bottom line.
The revenue base has been fairly resilient over several years, but the flow from sales to profit has become less efficient. Gross profit remained substantial, yet operating income and net income compressed materially, showing that the key issue recently has been profitability rather than a collapse in product demand.
Key Figures
| Metric | Value | Sector ⓘ |
|---|---|---|
| Date | Oct 24, 2026 | |
| Context | ||
| Sector | Healthcare | |
| Industry | Medical Instruments & Supplies | |
| Market Cap ⓘ | $5.53B | |
| Beta ⓘ | 0.83 | |
Value (Cheapness) | ||
| P/E Ratio ⓘ | N/A | 25.42 |
| P/B Ratio ⓘ | 2.05 | 3.08 |
| FCF Yield ⓘ | 7.07% | 3.12% |
| Dividend Yield ⓘ | 1.04% | 1.85% |
| EBIT / EV ⓘ | -3.90% | 0.56% |
| PEG ⓘ | 0.16 | |
Growth (Business expansion) | ||
| Revenue Growth ⓘ | 28.90% | 7.50% |
| RPS Growth (5Y CAGR) ⓘ | -6.87% | 8.60% |
| EPS Growth (5Y CAGR) ⓘ | -31.57% | -17.73% |
| BVPS Growth (5Y CAGR) ⓘ | -3.08% | 3.72% |
| Margin Growth (5Y Trend) ⓘ | -15.68% | -0.57% |
| FCF Growth (5Y CAGR) ⓘ | -19.34% | 0.96% |
| DPS Growth (5Y CAGR) ⓘ | 0.10% | 6.69% |
Quality (Business durability) | ||
| ROIC (Latest) ⓘ | -3.86% | 3.17% |
| ROA (Latest) ⓘ | -14.04% | 2.98% |
| ROIC (5Y Median) ⓘ | 7.13% | 4.56% |
| ROA (5Y Median) ⓘ | 4.93% | 1.87% |
| Net Debt / EBIT (Latest) ⓘ | N/A | 1.34 |
| Net Debt / EBIT (5Y Median) ⓘ | 3.28 | 1.86 |
| Net Debt / EBITDA (Latest) ⓘ | N/A | 1.00 |
| Net Debt / Assets ⓘ | 37.90% | 5.06% |
| EBITDA / Interest ⓘ | N/A | 9.55 |
| Operating Margin (Latest) ⓘ | -11.80% | 9.25% |
| Operating Margin (5Y Median) ⓘ | 17.45% | 7.33% |
| Debt to Equity (Latest) ⓘ | 98.90% | 26.68% |
| Profit Margin (Latest) ⓘ | -45.76% | 3.34% |
| Free Cash Flow (Latest) ⓘ | $390.63M | |
Momentum (Price trend) | ||
| 3Y Return ⓘ | -25.23% | +51.61% |
| 12M Return (excl. last month) ⓘ | +2.81% | +19.90% |
| 6M Return ⓘ | -1.11% | +10.10% |
| Price vs. 200-Day MA ⓘ | +10.24% | +6.44% |
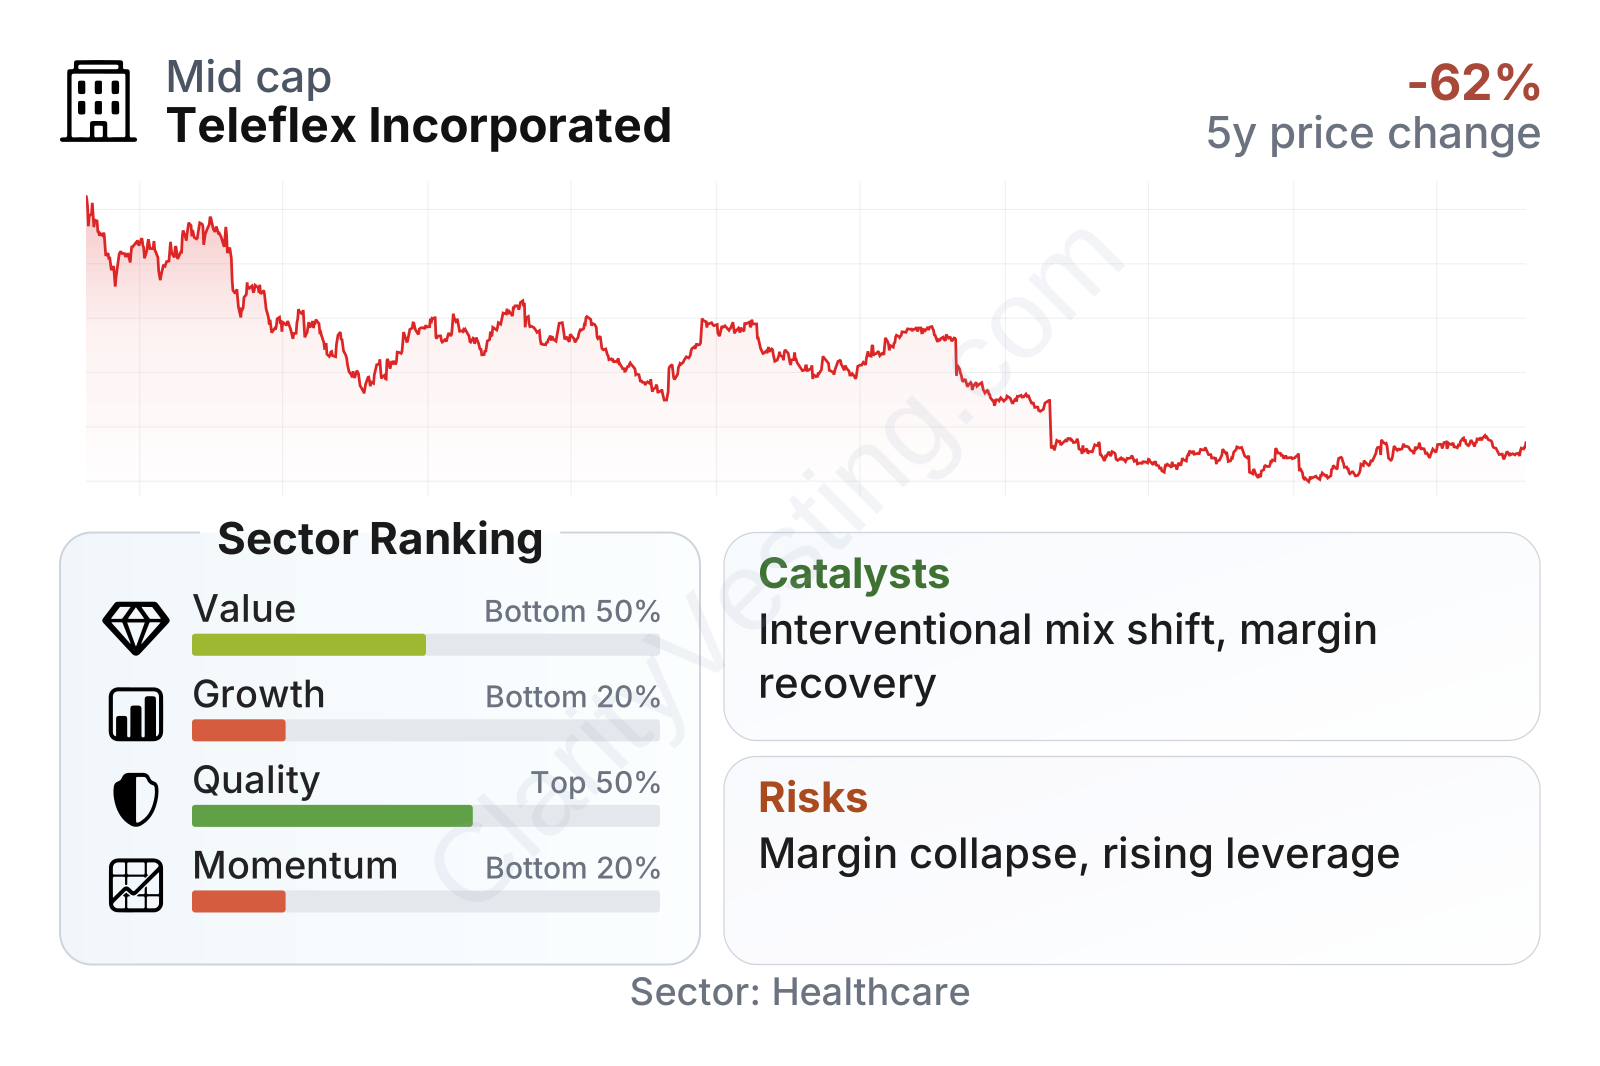
Teleflex is a mid-sized healthcare equipment company with a stock that has been much less volatile than the broader market, as shown by its beta below 1. The valuation picture is mixed. On one hand, the shares trade on a lower price-to-book ratio than the sector median and show a strong free cash flow yield near 7%, which points to meaningful cash generation relative to the current market value. On the other hand, recent earnings weakness has hurt several quality and growth measures, leaving the company in the lower end of the sector on those dimensions.
The table also shows an unusual combination: historical profitability over a multi-year period was solid compared with many healthcare peers, but trailing metrics look much weaker. That gap strongly suggests recent charges and margin pressure are distorting the current snapshot. For long-term readers, this means the business cannot be judged on one number alone: cash flow remains relevant, while reported earnings and returns have clearly deteriorated.
Growth
Teleflex operates in medical devices, a sector with favorable long-term demand drivers. Aging populations, growth in chronic disease, expansion of minimally invasive procedures, and the need for infection control and hospital efficiency all support continuing demand for many of its products. These are not speculative trends; they are deeply tied to routine patient care.
The company’s strategy also makes industrial sense. Teleflex focuses on specialized devices used in critical points of care, where hospitals typically prioritize performance, clinician familiarity, and regulatory compliance over the lowest possible price. That can support durable relationships and repeat purchasing. The company has also expanded through acquisitions over time, especially in interventional and cardiovascular categories, aiming to move into higher-value procedures rather than relying only on more mature hospital supplies.
Recent sales growth has been uneven. The company posted periods of healthy expansion in 2023 and parts of 2024, but the latest year-over-year readings turned negative. That pattern suggests Teleflex is going through a transition rather than enjoying clean, steady acceleration. For a long-term view, the more important question is whether newer product platforms and portfolio actions can restore stable growth after this softer stretch.
Cash generation has also become less consistent, but it remains an important support for the business. Free cash flow was much stronger a few years ago, dipped sharply in the most recent trailing period, and still remains positive. A positive cash profile gives Teleflex room to fund product development, maintain its dividend, and manage debt, even while earnings are under pressure.
A meaningful catalyst is the company’s continued push in higher-acuity categories such as interventional cardiology and structural heart-related tools. These markets tend to offer better long-term procedure growth than mature commodity-like hospital products. If Teleflex can integrate acquired assets well, launch incremental products, and improve commercial execution, that could gradually shift its mix toward faster-growing and potentially higher-margin segments.
Another important factor is portfolio simplification. Teleflex has taken steps in recent years to reshape the business around areas with stronger strategic fit. If that process removes weaker assets and improves focus, future revenue quality could matter more than short-term revenue quantity.
Risks
This article is for informational purposes only and does not constitute financial advice. Some content is AI-generated. See Disclaimer


