Stock Analysis · Triumph Financial Inc (TFIN)
Overview
Triumph Financial is a Texas-based financial company built around commercial banking and payments infrastructure for the trucking industry. Through its bank, factoring platform, and payment network, the company serves small and mid-sized businesses, with a particularly strong focus on freight brokers, motor carriers, and other transportation participants. In simple terms, it both lends money and helps move money across parts of the freight ecosystem.
The business is organized around several main activities. Based on recent company reporting, revenue is spread across banking, factoring, and payments-related operations, although the exact mix can shift from quarter to quarter because interest income, credit costs, and payment volumes move differently. The broad revenue picture is approximately as follows:
- Banking and interest-related income: about 55% to 65% of total revenue. This includes interest earned on loans and leases, investment securities, and other balance-sheet based banking activities, offset by funding costs.
- Factoring business: about 20% to 30%. Factoring mainly means purchasing invoices from freight brokers or carriers at a discount and collecting the cash later, while also providing working capital and back-office support.
- Payments and network-related fees: about 10% to 20%. This activity is centered on TriumphPay, which helps automate invoice presentment, audit, approval, and payment settlement in freight.
- Other noninterest income: generally a small single-source contribution. This can include service charges, gain-on-sale items, and other miscellaneous fee income.
What makes Triumph Financial different from a standard regional bank is that it is trying to combine a bank balance sheet with industry-specific software and payments rails. That combination matters because the more freight transactions move through its network, the more opportunities the company has to deepen customer relationships beyond lending alone.
The long-term financial picture shows a company that has rebuilt revenue after the 2023 profitability slump, but with expenses and funding costs still taking a heavy share of that revenue. Net income remains far below the levels seen a few years ago, which is the central issue behind the current investment debate.
Revenue recovered in 2024 and 2025 after a weak 2023, but a large portion of that improvement has been absorbed by operating expenses and higher interest expense. The business is no longer in the deep earnings drop seen during the freight downturn, yet margins are still much thinner than they were earlier in the cycle.
Key Figures
| Metric | Value | Sector ⓘ |
|---|---|---|
| Date | Oct 17, 2026 | |
| Context | ||
| Sector | Financial Services | |
| Industry | Banks - Regional | |
| Market Cap ⓘ | $1.46B | |
| Beta ⓘ | 1.53 | |
Value (Cheapness) | ||
| P/E Ratio ⓘ | 41.39 | 12.26 |
| P/B Ratio ⓘ | 1.55 | 1.23 |
| FCF Yield ⓘ | 6.37% | 10.40% |
| Dividend Yield ⓘ | N/A | 3.02% |
| EBIT / EV ⓘ | 6.64% | 8.14% |
| PEG ⓘ | 1.62 | |
Growth (Business expansion) | ||
| Revenue Growth ⓘ | 11.90% | 9.35% |
| RPS Growth (5Y CAGR) ⓘ | 5.45% | 12.19% |
| EPS Growth (5Y CAGR) ⓘ | -37.75% | -9.53% |
| BVPS Growth (5Y CAGR) ⓘ | 3.81% | 4.99% |
| Margin Growth (5Y Trend) ⓘ | -26.40% | -3.86% |
| FCF Growth (5Y CAGR) ⓘ | -19.84% | 4.81% |
| DPS Growth (5Y CAGR) ⓘ | 1.44% | 8.79% |
Quality (Business durability) | ||
| ROIC (Latest) ⓘ | 3.47% | 9.49% |
| ROE (Latest) ⓘ | 4.11% | 13.90% |
| ROA (Latest) ⓘ | 0.56% | 1.55% |
| ROIC (5Y Median) ⓘ | 2.28% | 7.86% |
| ROE (5Y Median) ⓘ | 4.43% | 12.17% |
| ROA (5Y Median) ⓘ | 0.71% | 1.30% |
| Net Debt / EBIT (Latest) ⓘ | 0.77 | 0.96 |
| Net Debt / EBIT (5Y Median) ⓘ | -0.18 | 0.73 |
| Net Debt / EBITDA (Latest) ⓘ | 0.47 | 0.92 |
| Operating Margin (Latest) ⓘ | 10.63% | 22.30% |
| Operating Margin (5Y Median) ⓘ | 9.06% | 24.63% |
| Debt to Equity (Latest) ⓘ | 11.76% | 58.56% |
| Profit Margin (Latest) ⓘ | 8.50% | 26.57% |
| Free Cash Flow (Latest) ⓘ | $93.19M | |
Momentum (Price trend) | ||
| 3Y Return ⓘ | +1.00% | +88.33% |
| 12M Return (excl. last month) ⓘ | +9.35% | +19.38% |
| 6M Return ⓘ | -0.82% | +4.75% |
| Price vs. 200-Day MA ⓘ | -8.23% | +3.50% |
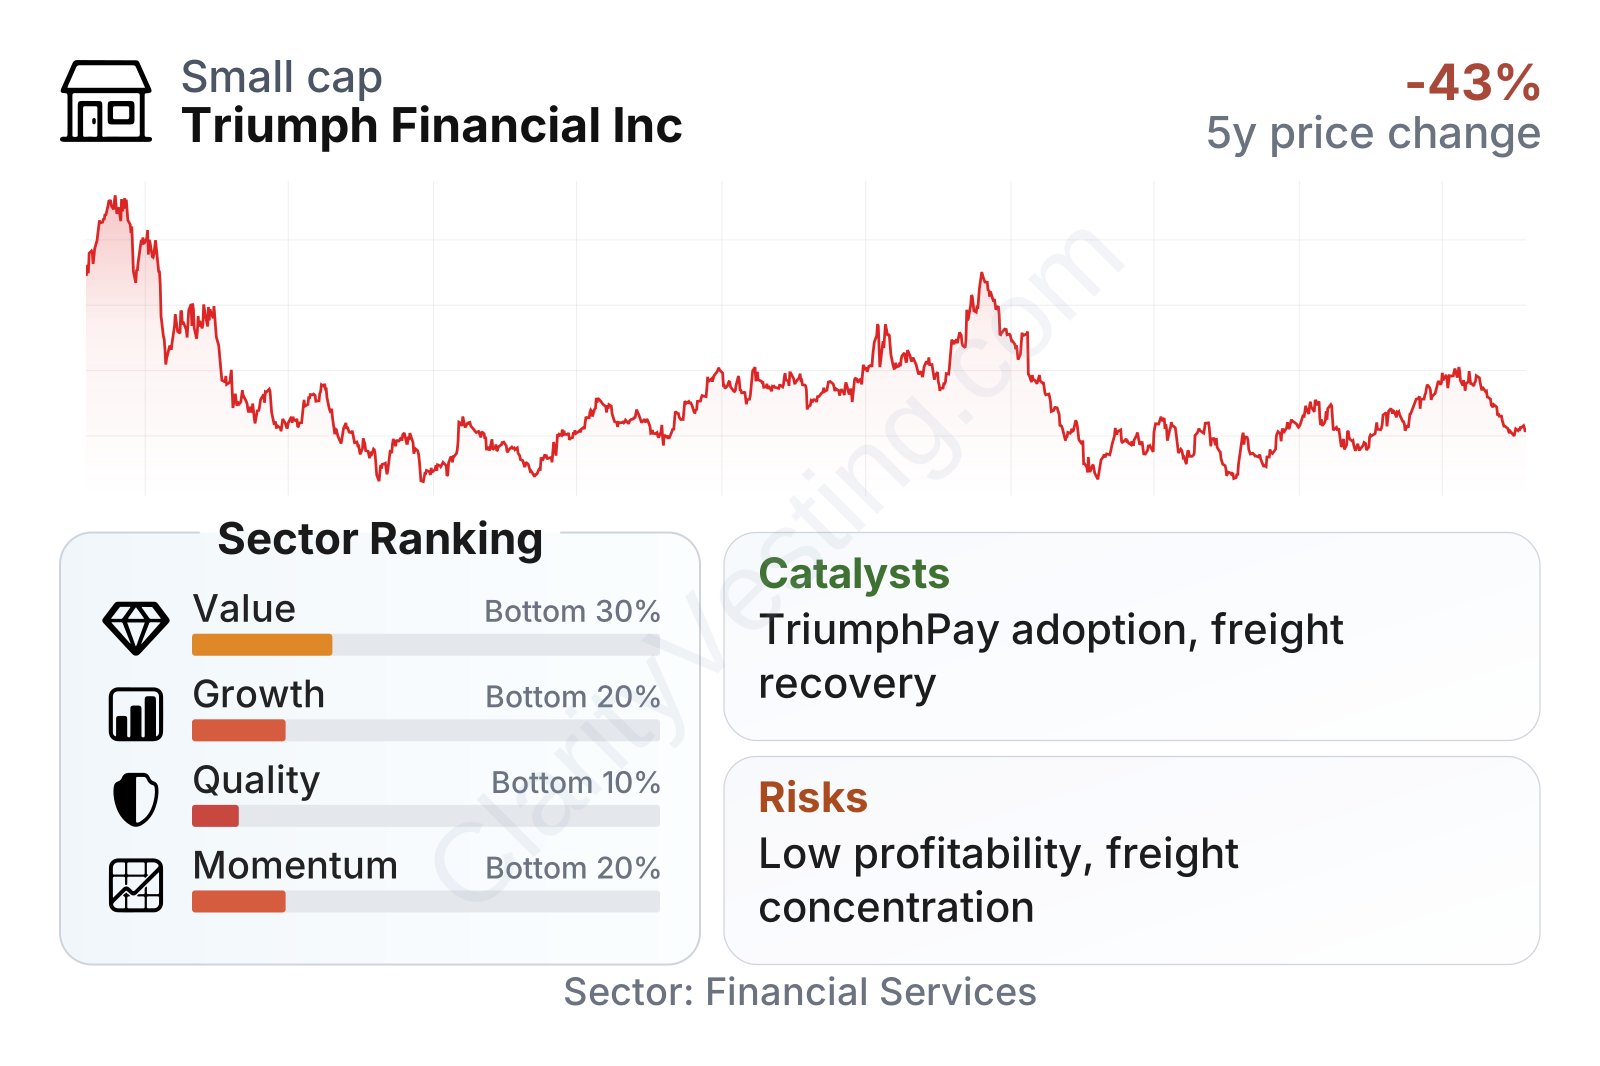
Triumph Financial is a small-cap financial company with above-average share price volatility, as reflected by a beta above 1.3. The stock has been highly cyclical over the past several years, falling sharply from 2021 highs before partially recovering, which fits the company’s exposure to freight activity and changing expectations around earnings normalization.
The factor breakdown is mixed. Valuation metrics place the stock in the weaker part of the sector, largely because earnings are currently depressed, which makes the price-to-earnings ratio look high relative to regional bank peers. Quality and growth rankings are also weak versus the sector, with profitability and multi-year earnings trends notably below median levels. Balance-sheet leverage, however, looks more conservative than many peers, which provides some financial flexibility even while returns remain subdued.
Growth
Triumph Financial operates in two areas with different growth profiles. Traditional regional banking is a mature industry, but freight payments digitization is still an evolving niche. That second area is the more important long-term growth piece. The company’s strategy is to use TriumphPay as a network platform inside trucking and freight settlement, where manual invoice handling, disputes, and payment delays have historically been common. If that network becomes more deeply embedded in freight workflows, growth could become less dependent on loan expansion and more tied to transaction activity and software-like fee streams.
This strategy is logical because it aims to move the company away from being valued only as a lender. A conventional bank is usually judged on spreads, credit quality, and deposit costs. A payments network with specialized industry connectivity can earn higher strategic value if it becomes difficult for customers to replace. That is the key idea behind Triumph Financial’s long-range positioning.
There are also some early signs of stabilization. Revenue growth has recently been better than the sector median on a year-over-year basis, even though the longer five-year growth profile remains weak. Book value per share has continued to edge upward over time, which suggests that despite the earnings reset, the franchise has still been adding capital on a per-share basis.
Earnings per share illustrate the challenge clearly. The company earned much more in 2021 and 2022 than it has in the last two years. There was a modest improvement after the low point, but earnings have not returned to prior levels. For long-term analysis, that means the central question is not whether the business once produced strong profits, but whether its payments expansion and a better freight cycle can lift profitability back toward those earlier ranges.
Book value per share has moved in a steadier direction than earnings. That matters for a financial company because book value often reflects the durability of the balance sheet and retained capital. The increase has not been especially fast, but it has been positive, which somewhat offsets the concern created by weak recent earnings.
A meaningful catalyst is the continued scaling of TriumphPay. Public company updates in 2026 have pointed to new network adoption, transaction growth initiatives, and efforts to deepen integration across brokers, factors, and carriers. If the platform captures a larger share of freight settlements, Triumph Financial could gradually look less like a cyclical lender and more like a specialized financial infrastructure company. Another potential tailwind is any broader recovery in trucking volumes and freight market conditions, which would support both factoring activity and payment flows.
Risks
This article is for informational purposes only and does not constitute financial advice. Some content is AI-generated. See Disclaimer


