Stock Analysis · Truist Financial Corp (TFC)
Overview
Truist Financial is a large U.S. regional bank created through the merger of BB&T and SunTrust. It serves consumers, small businesses, middle-market companies, and large corporate and institutional clients. Its activities span everyday banking, lending, payments, wealth management, insurance brokerage, capital markets, and commercial real estate finance. In simple terms, Truist makes money mostly by taking deposits, lending those funds at higher rates, charging fees for banking and advisory services, and earning commissions from insurance and wealth businesses.
Its revenue base is fairly diversified for a regional bank, which matters because it reduces dependence on any single line of business. Based on recent company reporting, the main sources of revenue can be approximated as follows:
- Net interest income: about 65% to 75% of total revenue. This is the spread between what Truist earns on loans and securities and what it pays on deposits and other funding.
- Insurance Holdings: about 8% to 12%. This includes brokerage commissions and fees from commercial and personal insurance distribution.
- Wealth, brokerage and asset management: about 6% to 10%. This covers advisory fees, trust services, brokerage, and investment management.
- Service charges on deposits and payment-related fees: about 4% to 8%. This includes account fees, card-related income, and treasury/payment services.
- Investment banking and trading, including capital markets: about 3% to 7%. This includes underwriting, advisory, trading, and loan syndication activities.
- Mortgage and other lending-related fees: usually a smaller contribution, depending on housing activity, refinancing demand, and rate conditions.
Over the last several years, the broad pattern has been volatile rather than smooth. Revenue rebounded strongly in 2025 after pressure from higher funding costs and one-time issues in earlier periods. The expense base has been relatively sticky, while interest expense rose sharply when rates moved up, which helps explain why earnings quality has looked uneven compared with some peers.
The business mix shows why Truist is more than a plain vanilla lender: fee businesses such as insurance and wealth management provide support when loan growth slows. At the same time, the sharp jump in interest expense during the rate shock period shows how sensitive bank profitability can be when deposit costs rise faster than asset yields.
Key Figures
| Metric | Value | Sector ⓘ |
|---|---|---|
| Date | Oct 20, 2026 | |
| Context | ||
| Sector | Financial Services | |
| Industry | Banks - Regional | |
| Market Cap ⓘ | $56.59B | |
| Beta ⓘ | 0.91 | |
Value (Cheapness) | ||
| P/E Ratio ⓘ | 10.82 | 12.26 |
| P/B Ratio ⓘ | 0.92 | 1.23 |
| FCF Yield ⓘ | 10.24% | 10.33% |
| Dividend Yield ⓘ | 4.42% | 3.02% |
| EBIT / EV ⓘ | 8.11% | 8.14% |
| PEG ⓘ | 1.10 | |
Growth (Business expansion) | ||
| Revenue Growth ⓘ | -15.80% | 9.25% |
| RPS Growth (5Y CAGR) ⓘ | 8.50% | 12.19% |
| EPS Growth (5Y CAGR) ⓘ | -9.07% | -8.95% |
| BVPS Growth (5Y CAGR) ⓘ | 2.26% | 4.99% |
| Margin Growth (5Y Trend) ⓘ | -13.80% | -3.86% |
| FCF Growth (5Y CAGR) ⓘ | -6.32% | 4.81% |
| DPS Growth (5Y CAGR) ⓘ | 2.48% | 8.79% |
Quality (Business durability) | ||
| ROIC (Latest) ⓘ | N/A | 9.49% |
| ROE (Latest) ⓘ | 8.09% | 13.87% |
| ROA (Latest) ⓘ | 0.94% | 1.54% |
| ROIC (5Y Median) ⓘ | 4.52% | 7.86% |
| ROE (5Y Median) ⓘ | 7.72% | 12.17% |
| ROA (5Y Median) ⓘ | 0.98% | 1.30% |
| Net Debt / EBIT (Latest) ⓘ | 9.57 | 0.99 |
| Net Debt / EBIT (5Y Median) ⓘ | 5.26 | 0.73 |
| Net Debt / EBITDA (Latest) ⓘ | 9.40 | 0.91 |
| Operating Margin (Latest) ⓘ | 22.30% | 22.30% |
| Operating Margin (5Y Median) ⓘ | 20.86% | 24.63% |
| Debt to Equity (Latest) ⓘ | 107.02% | 58.32% |
| Profit Margin (Latest) ⓘ | 28.38% | 26.57% |
| Free Cash Flow (Latest) ⓘ | $5.80B | |
Momentum (Price trend) | ||
| 3Y Return ⓘ | +97.65% | +88.67% |
| 12M Return (excl. last month) ⓘ | +10.11% | +19.19% |
| 6M Return ⓘ | -6.52% | +4.70% |
| Price vs. 200-Day MA ⓘ | -5.30% | +3.66% |
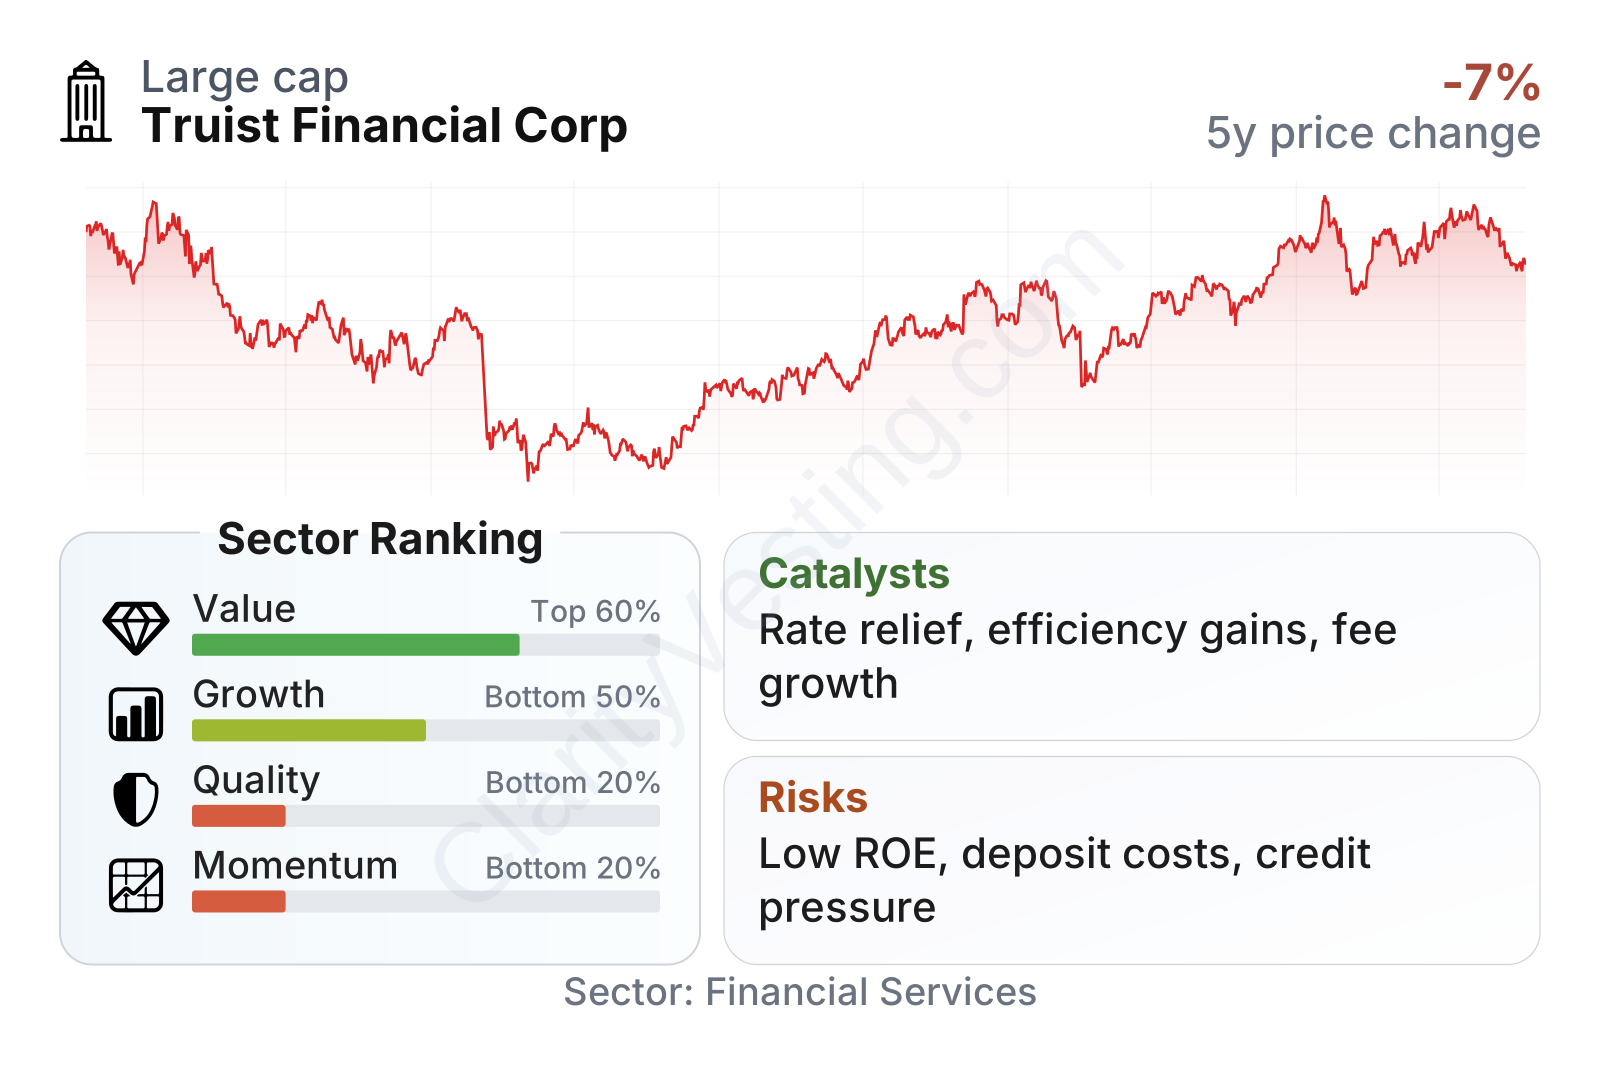
Truist is a very large regional bank with a market value in the tens of billions of dollars and a stock volatility slightly below the broader market. On valuation, it screens somewhat cheaper than the sector on both earnings and book value multiples, while its dividend yield is above the sector median. That combination gives the shares an income-and-value profile.
The weaker side is business quality and growth. Revenue has recently declined year over year, and most medium-term growth measures trail sector medians. Profitability metrics also sit below typical regional bank levels, which suggests the discount is tied to real operating challenges rather than market neglect alone. Price performance has recovered significantly from the 2023 stress period, but more recent momentum has lagged the sector.
Growth
Banking remains a mature industry, but it is still a growing one over long periods because it expands with the economy, household formation, business investment, and payment activity. For Truist, the more relevant question is not whether banking grows, but whether the bank can improve its earnings power faster than the average regional bank. That depends on deposit stability, loan growth, expense discipline, and continued development of fee-based businesses that are less tied to interest rates.
Management has been emphasizing simplification, balance sheet optimization, and productivity improvements. That strategy is sensible for a bank in Truist’s position. It does not need a dramatic new market to grow; it needs better execution from a strong Southeastern U.S. franchise, tighter cost control, and stronger returns on capital. The company also benefits from operating in attractive population-growth markets across the Southeast and Mid-Atlantic, where long-run demand for consumer banking, business banking, and wealth services tends to be healthier than in slower-growth regions.
Earnings per share show a clear pattern: a drop from 2021 through 2023, then stabilization and improvement afterward. That matters because it suggests the deepest earnings disruption may be in the rearview mirror, even if the recovery is still incomplete. A sustained move higher would likely require better net interest margin management and steadier fee income rather than simple balance-sheet expansion.
Book value per share also recovered after earlier pressure and has moved to new highs in the most recent annual periods. For banks, book value is an important anchor because it reflects the capital base supporting lending and absorbing losses. Rising book value alongside improving earnings usually points to a healthier rebuild in franchise economics, even if returns are not yet where stronger peers operate.
A meaningful catalyst is the path of interest rates. If funding costs ease or stabilize while loan and securities yields remain supportive, Truist could see margin relief. Another catalyst is operating efficiency: because the bank is large, even modest improvements in expenses, branch productivity, or technology execution can have a visible effect on earnings. Continued strength in insurance, wealth, and capital markets would also help by making revenue less dependent on pure spread income.
Recent company communications in 2026 have continued to focus on efficiency initiatives, capital strength, and balance sheet positioning. None of that changes the business overnight, but it does support the idea that current management priorities are aimed at improving returns rather than simply chasing loan volume.
Risks
This article is for informational purposes only and does not constitute financial advice. Some content is AI-generated. See Disclaimer


