Stock Analysis · Terex Corporation (TEX)
Overview
Terex Corporation is an industrial equipment manufacturer focused on machines used to lift, move, process, and support materials in construction, infrastructure, utilities, recycling, quarrying, and warehousing. In simple terms, it sells specialized equipment that helps customers handle heavy loads, work at height, and manage bulk materials more efficiently. The company operates globally and serves both new equipment buyers and customers that need parts, services, and support over the life of the machines.
Terex’s business mix has changed in recent years, especially after portfolio moves that increased its exposure to materials processing and environmental equipment. Based on the company’s recent reporting structure, revenue mainly comes from the following sources:
- Materials Processing: approximately 55% to 65% of revenue. This segment includes crushers, screeners, washing systems, environmental equipment, and other machines used in aggregates, recycling, waste, biomass, and related applications.
- Aerial Work Platforms: approximately 30% to 40% of revenue. This business includes boom lifts, scissor lifts, telehandlers, and other equipment used to safely lift workers and materials at height, largely under the Genie brand.
- Parts, services, and other recurring aftermarket activity: a smaller but strategically important share embedded across both main segments. While not always reported as a stand-alone segment, this revenue tends to be more resilient than new equipment sales and supports profitability through maintenance, replacement parts, and field support.
That revenue mix matters for long-term analysis. Materials Processing is tied to aggregates, recycling, and environmental applications, which can benefit from infrastructure and waste-management spending. Aerial Work Platforms is more cyclical and closely linked to construction and rental fleet demand. The combination gives Terex exposure to both traditional heavy equipment demand and areas with a more structural growth angle.
Over the last several years, Terex lifted revenue from roughly $3.9 billion in 2021 to about $5.4 billion in 2025. However, profits have been more uneven. Gross profit stayed above $1.0 billion in 2024 and 2025, but net income fell meaningfully from the 2023 peak as interest expense rose and margins narrowed. This suggests a business that has grown its sales base, but is still exposed to cycle swings, financing costs, and integration pressure from acquisitions.
The flow of revenue shows a clear pattern: sales expanded strongly from 2021 through 2025, but earnings conversion weakened after 2023. Operating income and net income peaked in 2023, then declined even as revenue stayed high, which points to margin pressure and much heavier interest costs rather than a collapse in demand.
Key Figures
| Metric | Value | Sector ⓘ |
|---|---|---|
| Date | Oct 03, 2026 | |
| Context | ||
| Sector | Industrials | |
| Industry | Farm & Heavy Construction Machinery | |
| Market Cap ⓘ | $6.10B | |
| Beta ⓘ | 1.50 | |
Value (Cheapness) | ||
| P/E Ratio ⓘ | 26.55 | 22.45 |
| P/B Ratio ⓘ | 1.22 | 1.98 |
| FCF Yield ⓘ | 5.56% | 6.31% |
| Dividend Yield ⓘ | 1.23% | 1.96% |
| EBIT / EV ⓘ | 2.23% | 4.81% |
| PEG ⓘ | 1.10 | |
Growth (Business expansion) | ||
| Revenue Growth ⓘ | 50.50% | 9.10% |
| RPS Growth (5Y CAGR) ⓘ | 10.51% | 7.75% |
| EPS Growth (5Y CAGR) ⓘ | -15.15% | -13.59% |
| BVPS Growth (5Y CAGR) ⓘ | 19.20% | 6.22% |
| Margin Growth (5Y Trend) ⓘ | 0.54% | 0.72% |
| FCF Growth (5Y CAGR) ⓘ | 8.34% | 10.98% |
| DPS Growth (5Y CAGR) ⓘ | 9.48% | 9.48% |
Quality (Business durability) | ||
| ROIC (Latest) ⓘ | 2.34% | 10.92% |
| ROA (Latest) ⓘ | 1.80% | 5.41% |
| ROIC (5Y Median) ⓘ | 18.77% | 9.21% |
| ROA (5Y Median) ⓘ | 7.49% | 4.94% |
| Net Debt / EBIT (Latest) ⓘ | 11.34 | 2.07 |
| Net Debt / EBIT (5Y Median) ⓘ | 1.59 | 2.28 |
| Net Debt / EBITDA (Latest) ⓘ | 5.15 | 1.43 |
| Net Debt / Assets ⓘ | 22.04% | 19.27% |
| EBITDA / Interest ⓘ | 1.60 | 9.53 |
| Operating Margin (Latest) ⓘ | 3.01% | 10.50% |
| Operating Margin (5Y Median) ⓘ | 9.42% | 10.27% |
| Debt to Equity (Latest) ⓘ | 54.56% | 65.48% |
| Profit Margin (Latest) ⓘ | 2.23% | 6.62% |
| Free Cash Flow (Latest) ⓘ | $339.00M | |
Momentum (Price trend) | ||
| 3Y Return ⓘ | -5.11% | +58.56% |
| 12M Return (excl. last month) ⓘ | +28.67% | +15.63% |
| 6M Return ⓘ | -10.52% | +4.19% |
| Price vs. 200-Day MA ⓘ | -14.97% | +0.93% |
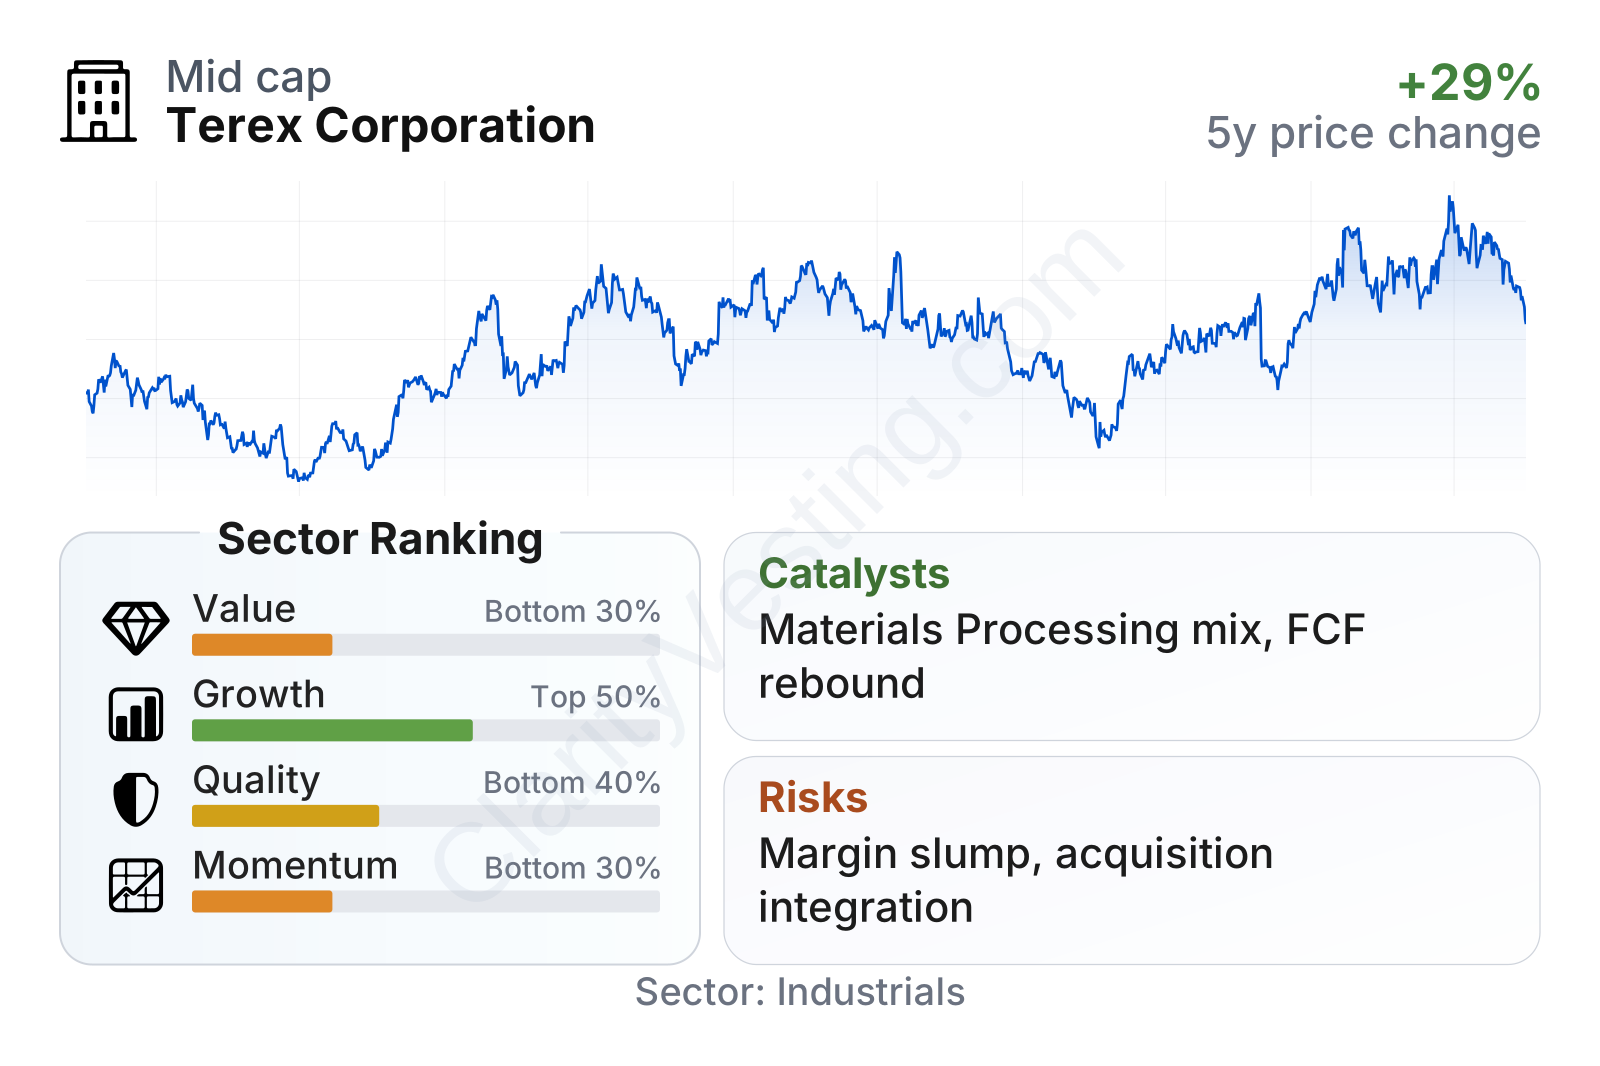
Terex is a mid-sized industrial company with a market value around $6 billion and a share price that has been volatile, which is consistent with its beta above 1.5. The stock has recovered well over the past year, but the longer three-year picture remains weaker than the broader industrial peer group.
The metrics table paints a mixed picture. Growth indicators are generally solid, helped by very strong recent revenue expansion and respectable five-year revenue-per-share growth. Book value per share has also risen well above the sector median over five years. On the other hand, current profitability and balance-sheet coverage measures are weaker than many peers. Valuation is not obviously cheap on earnings today, even though the price-to-book ratio is lower than the sector median. In short, the company looks stronger on business expansion than on current efficiency.
Growth
Terex operates in end markets that can grow over time, but not in a straight line. Construction equipment and lifting equipment are cyclical industries, meaning demand tends to rise and fall with economic conditions, rental fleet spending, interest rates, and infrastructure activity. What makes Terex more interesting than a basic cycle-only manufacturer is its increasing exposure to materials processing, recycling, environmental equipment, and automation-related warehouse solutions. Those areas are linked not only to construction, but also to waste handling, resource efficiency, and logistics modernization.
The company’s strategic direction broadly makes sense for future growth. Terex has spent the last few years reshaping its portfolio toward categories where equipment can be critical to operations and where aftermarket support can deepen customer relationships. The Materials Processing segment gives it exposure to aggregates and recycling demand, while the Genie business remains a recognized brand in aerial work platforms. Terex has also expanded in warehouse automation and solutions, which may help diversify the business away from purely traditional heavy machinery over time.
Recent revenue trends show how sharp that rebound has been. Growth was very strong in 2022 and 2023, slowed and turned uneven through parts of 2024 and 2025, and then accelerated again in the most recent periods. A growth rate above 50% year over year is far above the sector median, but that kind of jump also deserves caution because it may reflect acquisitions and comparison effects as much as underlying organic demand.
Cash generation has remained a supportive element. Free cash flow improved markedly from the low levels seen earlier in the period and recently moved back above $300 million on a trailing basis. That does not remove the cyclicality of the business, but it shows Terex is still converting a meaningful share of earnings into cash, which matters for debt service, acquisitions, dividends, and share repurchases.
A notable catalyst for future growth is the company’s portfolio repositioning. Recent acquisitions and segment changes have increased Terex’s exposure to categories with better long-term demand drivers than standard construction cycles alone. Infrastructure investment, quarry and aggregates activity, recycling needs, and warehouse automation can all support demand if execution remains disciplined. Another positive factor is the installed base of machines already in the field, since a larger installed base can generate more recurring parts and service revenue over time.
Recent company communications have also emphasized operational integration and business simplification. If that effort succeeds, the main opportunity is not just selling more machines, but improving the amount of profit earned on each dollar of revenue.
Risks
This article is for informational purposes only and does not constitute financial advice. Some content is AI-generated. See Disclaimer


