Stock Analysis · ServisFirst Bancshares Inc (SFBS)
Overview
ServisFirst Bancshares is a regional bank holding company based in the southeastern United States. Through ServisFirst Bank, it provides commercial banking services such as business loans, commercial real estate lending, deposit accounts, treasury management, and correspondent banking services for other financial institutions. Its model is centered on relationship banking: serving businesses, professionals, and wealthy households with a relatively focused branch footprint rather than operating as a mass-market national bank.
For a bank, revenue does not come from selling products in the usual sense. The main engine is the spread between what it earns on loans and securities and what it pays on deposits and other funding. Non-interest income exists, but it is much smaller than the lending business.
Based on the company’s recent annual reporting structure, ServisFirst’s revenue mix can be summarized approximately as follows:
- Net interest income: about 85% to 95% — income from commercial loans, real estate loans, mortgage warehouse lending, investment securities, and other interest-earning assets, minus interest paid on deposits and borrowings.
- Service charges and fees: about 3% to 8% — deposit account fees, treasury and cash-management related fees, and other banking service charges.
- Other non-interest income: about 2% to 7% — items such as correspondent banking-related revenue, credit card and interchange activity, and gains or miscellaneous banking income.
That concentration matters. ServisFirst is primarily a traditional spread-based bank, so its results are especially sensitive to loan growth, deposit costs, credit quality, and interest rates. The long-term attraction of this model is simplicity and recurring customer relationships, but it also means the company has less diversification than larger banks with wealth management, investment banking, or large fee platforms.
The business has also shown that revenue and profit have expanded meaningfully over the last several years, even though funding costs rose sharply across the banking industry. Expenses increased much more slowly than revenue over that period, which helps explain why profitability remains stronger than many regional peers.
Over the past five years, revenue and net income have both trended upward overall, with a notable recovery after the pressure seen in 2023. The broader pattern suggests the bank has been able to protect earnings power despite a much more expensive funding environment.
Key Figures
| Metric | Value | Sector ⓘ |
|---|---|---|
| Date | Oct 23, 2026 | |
| Context | ||
| Sector | Financial Services | |
| Industry | Banks - Regional | |
| Market Cap ⓘ | $4.52B | |
| Beta ⓘ | 0.91 | |
Value (Cheapness) | ||
| P/E Ratio ⓘ | 12.71 | 12.46 |
| P/B Ratio ⓘ | 2.22 | 1.25 |
| FCF Yield ⓘ | 10.31% | 9.82% |
| Dividend Yield ⓘ | 2.87% | 2.94% |
| EBIT / EV ⓘ | 7.29% | 8.11% |
| PEG ⓘ | N/A | |
Growth (Business expansion) | ||
| Revenue Growth ⓘ | 24.30% | 9.10% |
| RPS Growth (5Y CAGR) ⓘ | 3.74% | 12.31% |
| EPS Growth (5Y CAGR) ⓘ | -4.70% | -6.97% |
| BVPS Growth (5Y CAGR) ⓘ | -5.44% | 5.02% |
| Margin Growth (5Y Trend) ⓘ | -24.29% | -4.00% |
| FCF Growth (5Y CAGR) ⓘ | 7.98% | 4.71% |
| DPS Growth (5Y CAGR) ⓘ | 2.85% | 8.92% |
Quality (Business durability) | ||
| ROIC (Latest) ⓘ | 16.74% | 9.18% |
| ROE (Latest) ⓘ | 17.62% | 13.93% |
| ROA (Latest) ⓘ | 1.90% | 1.57% |
| ROIC (5Y Median) ⓘ | 15.52% | 7.80% |
| ROE (5Y Median) ⓘ | 15.96% | 12.15% |
| ROA (5Y Median) ⓘ | 1.52% | 1.28% |
| Net Debt / EBIT (Latest) ⓘ | 0.40 | 1.02 |
| Net Debt / EBIT (5Y Median) ⓘ | -1.14 | 0.72 |
| Net Debt / EBITDA (Latest) ⓘ | 1.92 | 0.88 |
| Operating Margin (Latest) ⓘ | 38.20% | 22.30% |
| Operating Margin (5Y Median) ⓘ | 33.62% | 24.50% |
| Debt to Equity (Latest) ⓘ | 98.18% | 59.34% |
| Profit Margin (Latest) ⓘ | 55.59% | 26.42% |
| Free Cash Flow (Latest) ⓘ | $465.65M | |
Momentum (Price trend) | ||
| 3Y Return ⓘ | +85.46% | +95.73% |
| 12M Return (excl. last month) ⓘ | +2.55% | +17.30% |
| 6M Return ⓘ | +6.20% | +6.07% |
| Price vs. 200-Day MA ⓘ | +2.30% | +5.36% |
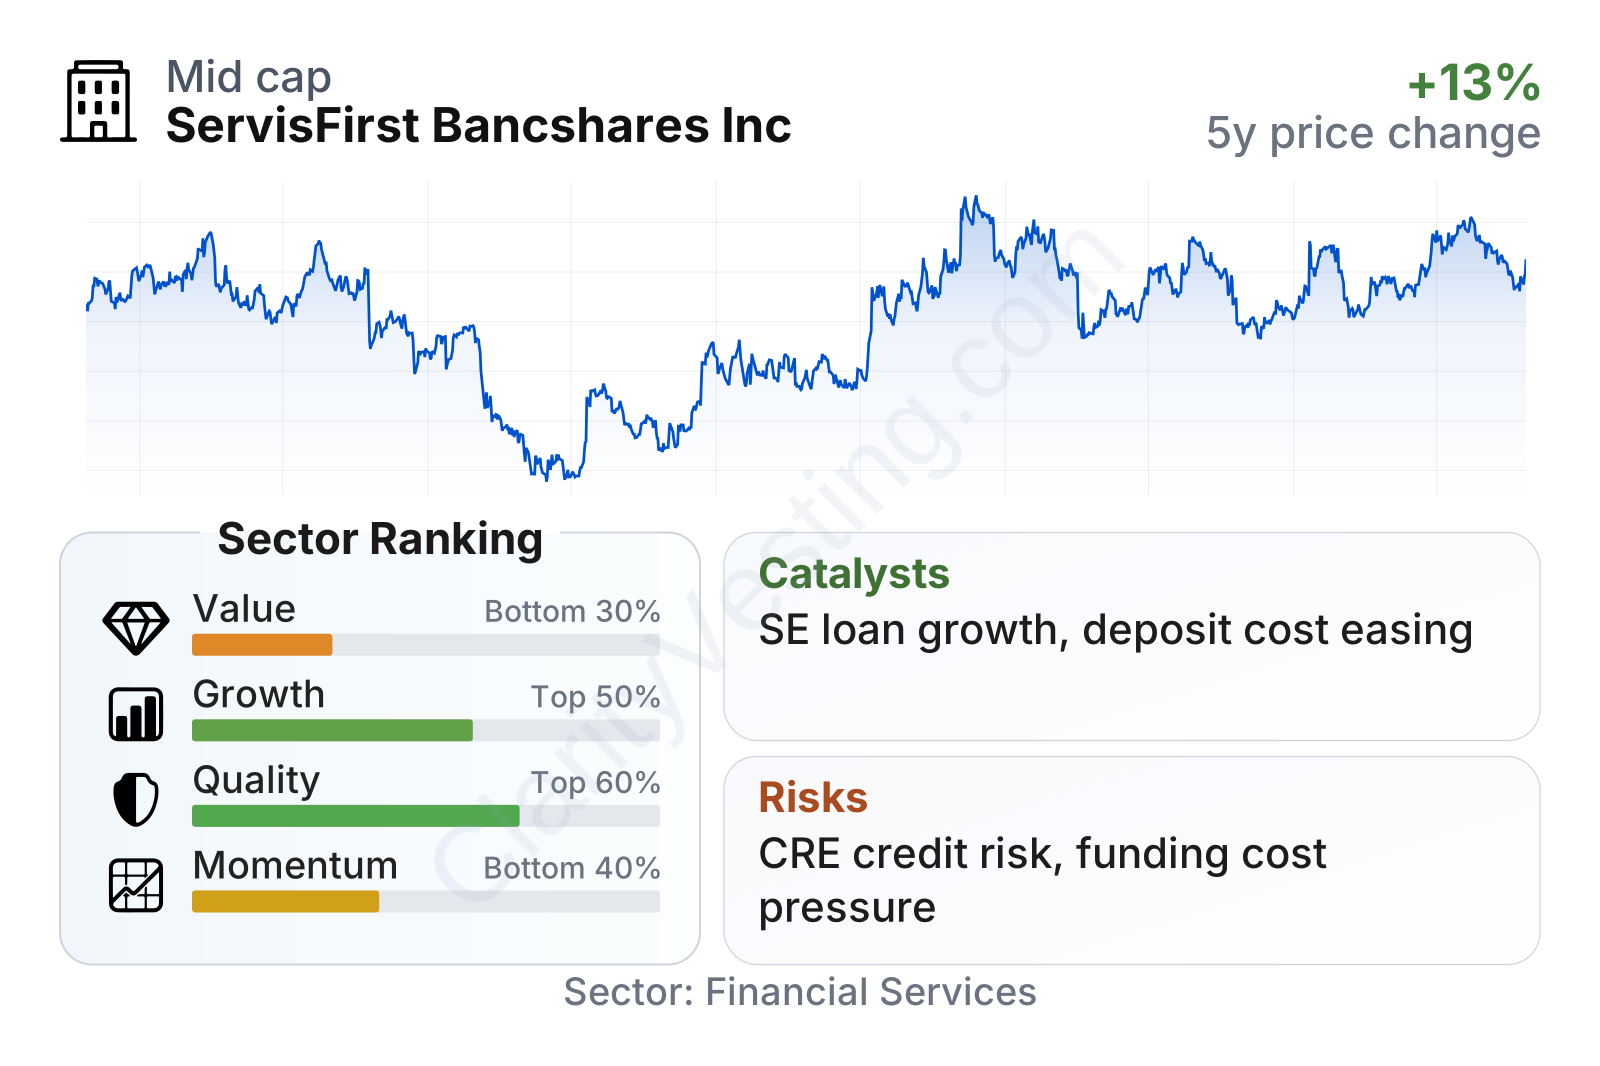
ServisFirst sits in the mid-sized regional bank range, with a market value around the mid-single-digit billions of dollars and share-price volatility slightly below the broader market. The metrics present a mixed but understandable picture: quality is clearly above average, recent growth is solid, valuation is not obviously cheap, and market momentum has been weaker than many sector peers.
Profitability stands out the most. Return on equity, return on assets, operating margin, and profit margin are all ahead of the sector median, which is unusual in regional banking and suggests disciplined underwriting and expense control. On the other hand, the value profile is less attractive because the stock trades near the sector median on earnings but at a clear premium on book value. Growth also needs context: recent year-over-year revenue growth has been strong, but longer-term growth in book value per share and revenue per share has been more uneven.
Growth
ServisFirst operates in a sector that is mature rather than fast-growing, but that does not mean growth is absent. Regional banks can still expand through market share gains, commercial client acquisition, new office openings in attractive metro areas, and deeper product use by existing customers. In the Southeast, population and business formation trends have generally been more favorable than in many slower-growing U.S. regions, which gives banks like ServisFirst a better backdrop than some northern or rural peers.
The company’s strategy is coherent for that environment. It focuses on commercial clients and relationship banking, where speed of service, local decision-making, and lender relationships can matter more than national scale. That niche has allowed many regional banks to grow faster than the overall industry when execution is strong. ServisFirst has also built a reputation around serving businesses and professional clients, which can support higher-value deposit and lending relationships.
Earnings per share show the basic pattern clearly: strong expansion in 2022, a setback in 2023 during the more difficult rate environment for banks, then renewed improvement in 2024 and 2025. That rebound is important because it suggests the pressure from deposit repricing did not permanently impair the franchise. The more recent figures point to continued earnings capacity rather than a one-year spike.
Book value per share, a key balance-sheet measure for banks, fell sharply in 2022 and then rebuilt steadily through 2025. That recovery matters because long-term value creation in banking usually depends on the ability to compound capital while also generating solid returns on that capital. The fact that book value has been climbing again, together with stronger earnings, supports the view that the business regained financial momentum after the industry stress period.
Potential catalysts are fairly specific. Continued loan growth in commercial banking, stabilization or improvement in deposit costs, and further expansion in southeastern markets could all lift revenue and profitability. If interest rates become more favorable for banks’ funding economics, ServisFirst could benefit because its business mix is heavily tied to net interest income. Recent company updates and filings have also emphasized healthy profitability and capital generation, which create room for continued balance-sheet growth and shareholder distributions without changing the core strategy.
Risks
This article is for informational purposes only and does not constitute financial advice. Some content is AI-generated. See Disclaimer


