Stock Analysis · Teva Pharma Industries Ltd (TEVA)
Overview
Teva Pharmaceutical Industries is a global drugmaker best known for two businesses: generic medicines and a smaller portfolio of branded specialty drugs. Generics are lower-cost versions of medicines whose patents have expired, while specialty drugs are branded treatments for complex conditions such as neurological and respiratory diseases. Teva also manufactures active pharmaceutical ingredients and operates a broad commercial and supply network across North America, Europe, and international markets.
The company’s revenue mix is still led by generics, but branded products play an important role in profitability because they typically carry higher margins. Based on the company’s recent annual reporting structure and product disclosures, Teva’s main revenue sources can be summarized as follows:
- Generic medicines: about 55% to 60% of revenue. This includes a wide portfolio of off-patent prescription drugs sold in the United States, Europe, and many other countries.
- Innovative or specialty branded medicines: about 25% to 30% of revenue. Key products include Austedo for movement disorders, Ajovy for migraine prevention, and Uzedy for schizophrenia.
- Over-the-counter products, biosimilars, and other activities: about 10% to 15% of revenue. This bucket includes consumer health products in certain markets, partnerships, and other smaller commercial lines.
Geographically, Teva remains highly exposed to the United States, which is its largest market, followed by Europe and a diversified group of international markets. That mix matters because the U.S. market offers scale and new product opportunities, but it is also where price competition in generics can be strongest.
Over the last few years, the business has become more balanced. Legacy issues tied to older products and legal overhangs have not disappeared, but newer branded medicines are contributing more meaningfully, and the broader product base reduces dependence on any single medicine compared with many biotech companies.
The revenue and profit flow shows a business that has recovered from a difficult 2022. Sales moved back up and gross profit improved through 2025, while operating profitability rebounded after large charges disrupted earlier results. Interest expense remains heavy, which is an important reminder that debt still absorbs a meaningful part of the company’s earnings power.
Key Figures
| Metric | Value | Sector ⓘ |
|---|---|---|
| Date | Oct 03, 2026 | |
| Context | ||
| Sector | Healthcare | |
| Industry | Drug Manufacturers - Specialty & Generic | |
| Market Cap ⓘ | $46.19B | |
| Beta ⓘ | 0.80 | |
Value (Cheapness) | ||
| P/E Ratio ⓘ | 66.00 | 24.06 |
| P/B Ratio ⓘ | 5.99 | 3.08 |
| FCF Yield ⓘ | 2.92% | 3.07% |
| Dividend Yield ⓘ | N/A | 2.05% |
| EBIT / EV ⓘ | 2.77% | 0.63% |
| PEG ⓘ | 0.71 | |
Growth (Business expansion) | ||
| Revenue Growth ⓘ | -0.80% | 7.50% |
| RPS Growth (5Y CAGR) ⓘ | 0.64% | 8.70% |
| EPS Growth (5Y CAGR) ⓘ | -18.60% | -18.20% |
| BVPS Growth (5Y CAGR) ⓘ | -5.39% | 3.95% |
| Margin Growth (5Y Trend) ⓘ | -7.00% | -0.58% |
| FCF Growth (5Y CAGR) ⓘ | 48.51% | 0.88% |
| DPS Growth (5Y CAGR) ⓘ | -56.55% | 6.80% |
Quality (Business durability) | ||
| ROIC (Latest) ⓘ | 11.74% | 3.29% |
| ROA (Latest) ⓘ | 1.77% | 3.02% |
| ROIC (5Y Median) ⓘ | 6.08% | 4.75% |
| ROA (5Y Median) ⓘ | -1.28% | 1.93% |
| Net Debt / EBIT (Latest) ⓘ | 8.24 | 1.33 |
| Net Debt / EBIT (5Y Median) ⓘ | 6.69 | 1.83 |
| Net Debt / EBITDA (Latest) ⓘ | 5.10 | 0.99 |
| Net Debt / Assets ⓘ | 33.17% | 5.33% |
| EBITDA / Interest ⓘ | 2.88 | 9.63 |
| Operating Margin (Latest) ⓘ | 9.27% | 9.25% |
| Operating Margin (5Y Median) ⓘ | 12.39% | 7.80% |
| Debt to Equity (Latest) ⓘ | 217.53% | 28.99% |
| Profit Margin (Latest) ⓘ | 4.08% | 3.60% |
| Free Cash Flow (Latest) ⓘ | $1.35B | |
Momentum (Price trend) | ||
| 3Y Return ⓘ | +292.71% | +37.48% |
| 12M Return (excl. last month) ⓘ | +96.90% | +20.85% |
| 6M Return ⓘ | +29.95% | +9.73% |
| Price vs. 200-Day MA ⓘ | +16.88% | +4.69% |
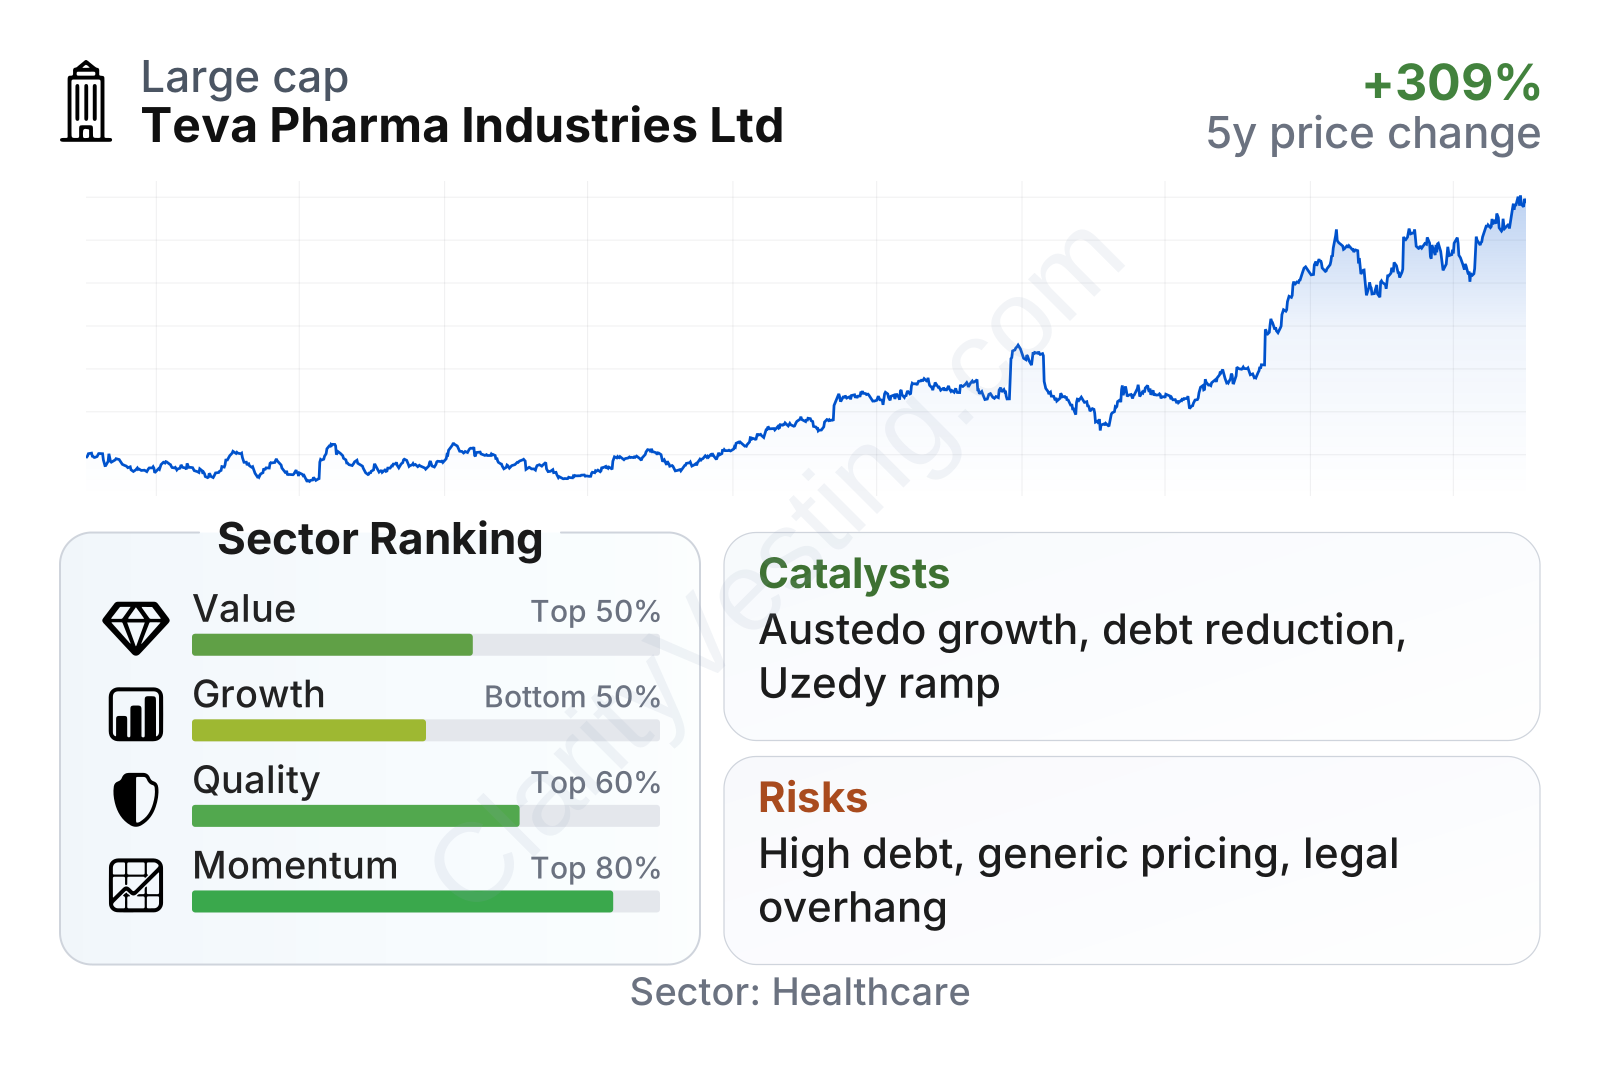
Teva is a large healthcare company with lower share-price volatility than many drug stocks, but its financial profile is mixed. On one side, profitability and returns on invested capital are better than much of the sector, and recent price momentum has been unusually strong. On the other, growth ranks below the sector median, leverage remains high, and valuation multiples have expanded well above typical healthcare levels. Free cash flow generation is real, but the balance sheet still limits flexibility.
Growth
Teva operates in a sector with durable long-term demand. The need for medicines generally rises with aging populations, broader healthcare access, and growing prevalence of chronic disease. Within that setting, Teva is positioned in two segments with different growth profiles: generics, which are mature and price-sensitive, and specialty branded therapies, where successful products can grow much faster.
The company’s current strategy is centered on shifting the mix toward higher-value branded medicines while continuing to use its scale in generics to support cash generation. That strategy is logical. Generics alone rarely create strong long-term growth because prices tend to come under pressure, but Teva’s branded portfolio can potentially lift revenue quality and margins if products continue gaining adoption.
Recent revenue growth has been uneven rather than consistently strong. After a period of declines, Teva returned to growth in 2023 and 2024, then recent year-over-year comparisons softened again into low single digits and slightly negative territory. That pattern suggests the turnaround is real but not yet fully smooth, and it helps explain why the market is focusing more on future product execution than on headline sales expansion alone.
Cash generation is a more constructive part of the picture. Free cash flow has improved meaningfully from the low levels seen a few years ago, and the latest trailing period is notably stronger than the prior years shown. For a company with sizable debt obligations, that matters because cash flow supports both deleveraging and investment in launches, manufacturing, and development.
The strongest growth catalyst appears to be Austedo, which management has positioned as a major branded driver. Teva has also been building newer assets such as Uzedy, a long-acting schizophrenia treatment, and continuing to expand Ajovy. If these medicines keep gaining share, the business mix can gradually become less dependent on low-growth generic categories.
Another relevant opportunity comes from biosimilars and complex generics. These products are harder to manufacture and approve than standard generics, which can create better pricing and weaker competition. Teva’s manufacturing footprint, regulatory experience, and global commercial presence give it a reasonable basis to compete in that area.
Recent company communications in 2026 have continued to emphasize execution on branded growth, pipeline progress, and debt reduction. None of that turns Teva into a high-growth pharmaceutical company overnight, but it does support the idea of a business moving from stabilization toward more selective expansion.
Risks
This article is for informational purposes only and does not constitute financial advice. Some content is AI-generated. See Disclaimer


