Stock Analysis · Bio-Techne Corp (TECH)
Overview
Bio-Techne is a life sciences tools and diagnostics company that sells products and services used by researchers, drug developers, and clinical laboratories. In simple terms, it helps scientists study biology, supports companies developing new medicines, and provides testing technologies used in healthcare settings. Its brands are active in areas such as proteins, antibodies, reagents, cell and gene therapy tools, genomic analysis, and diagnostic instruments.
The business is organized mainly into two operating segments. Based on the latest annual filing for fiscal 2026, revenue is concentrated as follows:
- Protein Sciences segment: about 73% of revenue. This includes reagents, antibodies, proteins, immunoassays, cell biology tools, and analytical solutions sold largely to academic labs, biotechnology companies, and pharmaceutical customers.
- Diagnostics and Spatial Biology segment: about 27% of revenue. This includes diagnostic controls, molecular diagnostics components, and spatial biology platforms used to analyze tissue and cell samples with high precision.
Within those segments, Bio-Techne also has exposure to attractive niches such as cell and gene therapy manufacturing support, exosome-related products, and advanced tissue analysis. That mix matters because it gives the company recurring demand from research labs while also creating links to faster-growing areas of medicine.
The financial profile shows a business with strong gross profitability and a meaningful rebound in earnings after a weaker fiscal 2025. Revenue has been broadly stable to modestly growing in recent years, while operating discipline improved again in fiscal 2026 after a notable margin squeeze in the prior year.
The income flow highlights a resilient gross profit base even when earnings were under pressure. Revenue has stayed around the same general range over the past few years, but operating income and net income were much more volatile, which shows that expense control and product mix have had a large effect on profitability.
Key Figures
| Metric | Value | Sector ⓘ |
|---|---|---|
| Date | Oct 24, 2026 | |
| Context | ||
| Sector | Healthcare | |
| Industry | Biotechnology | |
| Market Cap ⓘ | $11.39B | |
| Beta ⓘ | 1.29 | |
Value (Cheapness) | ||
| P/E Ratio ⓘ | 62.62 | 25.42 |
| P/B Ratio ⓘ | 5.41 | 3.08 |
| FCF Yield ⓘ | 2.31% | 3.12% |
| Dividend Yield ⓘ | 0.44% | 1.85% |
| EBIT / EV ⓘ | 2.16% | 0.56% |
| PEG ⓘ | 2.11 | |
Growth (Business expansion) | ||
| Revenue Growth ⓘ | 1.30% | 7.50% |
| RPS Growth (5Y CAGR) ⓘ | 3.53% | 8.60% |
| EPS Growth (5Y CAGR) ⓘ | -1.82% | -17.73% |
| BVPS Growth (5Y CAGR) ⓘ | 6.66% | 3.72% |
| Margin Growth (5Y Trend) ⓘ | -8.03% | -0.57% |
| FCF Growth (5Y CAGR) ⓘ | -1.56% | 0.96% |
| DPS Growth (5Y CAGR) ⓘ | 0.98% | 6.69% |
Quality (Business durability) | ||
| ROIC (Latest) ⓘ | 8.14% | 3.17% |
| ROA (Latest) ⓘ | 7.11% | 2.98% |
| ROIC (5Y Median) ⓘ | 13.32% | 4.56% |
| ROA (5Y Median) ⓘ | 6.95% | 1.87% |
| Net Debt / EBIT (Latest) ⓘ | 0.10 | 1.34 |
| Net Debt / EBIT (5Y Median) ⓘ | 0.78 | 1.86 |
| Net Debt / EBITDA (Latest) ⓘ | 0.07 | 1.00 |
| Net Debt / Assets ⓘ | 0.94% | 5.06% |
| EBITDA / Interest ⓘ | 30.53 | 9.55 |
| Operating Margin (Latest) ⓘ | 20.25% | 9.25% |
| Operating Margin (5Y Median) ⓘ | 20.25% | 7.33% |
| Debt to Equity (Latest) ⓘ | 13.71% | 26.68% |
| Profit Margin (Latest) ⓘ | 14.97% | 3.34% |
| Free Cash Flow (Latest) ⓘ | $263.22M | |
Momentum (Price trend) | ||
| 3Y Return ⓘ | +16.46% | +51.61% |
| 12M Return (excl. last month) ⓘ | +37.71% | +19.90% |
| 6M Return ⓘ | +24.47% | +10.10% |
| Price vs. 200-Day MA ⓘ | +15.64% | +6.44% |
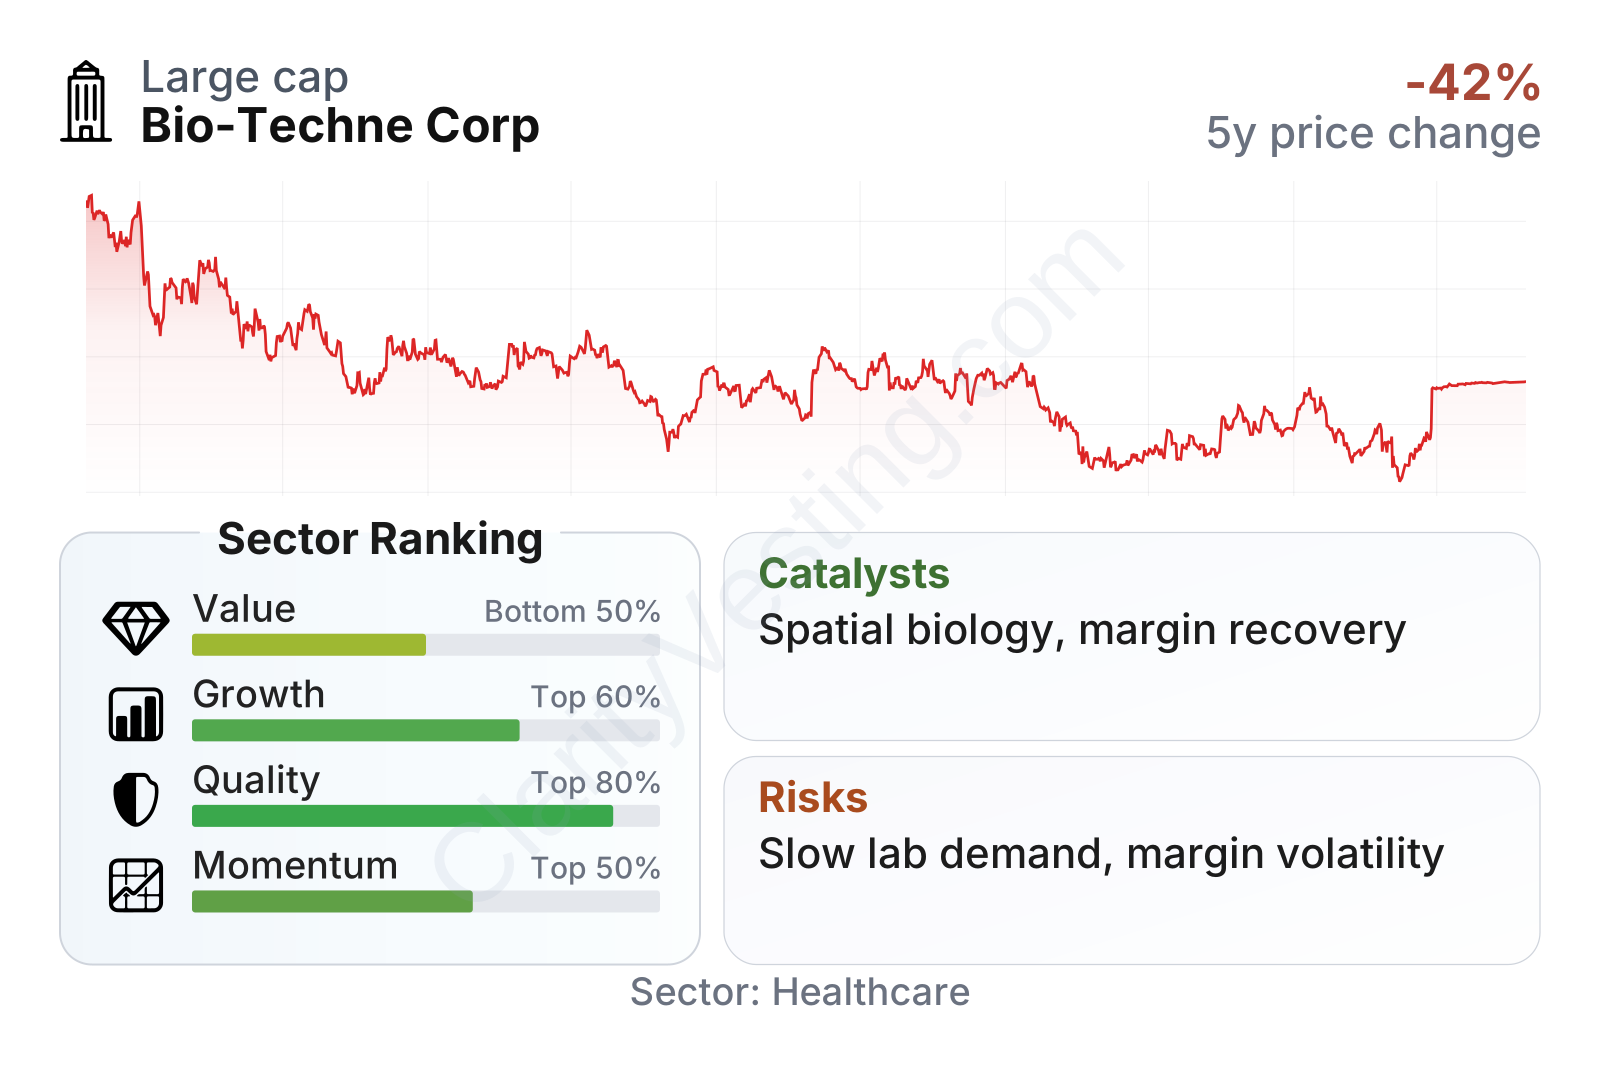
Bio-Techne stands out more for quality than for value. Profitability metrics remain well above the sector median, leverage is low, and returns on capital are solid for a healthcare tools company. Growth is more mixed: recent revenue expansion has been modest compared with the broader biotechnology universe, and free cash flow growth over five years has not been especially strong. Market behavior has improved noticeably over the last 6 to 12 months, but the valuation multiples still sit well above sector norms.
The stock has also been volatile over the last several years. After trading much higher in 2021, it went through a sharp reset, then staged a strong recovery more recently. That pattern suggests the market has been re-pricing the business based on changing expectations for growth and margin recovery rather than treating it like a steady defensive name.
Growth
Bio-Techne operates in a sector with favorable long-term drivers. Demand for biological research tools, precision diagnostics, and cell and gene therapy support is tied to structural trends such as rising R&D spending, growth in biologic drugs, and the need for more advanced testing methods. These are not short-lived themes. Even when research budgets fluctuate, the broader direction of healthcare innovation still supports demand for specialized tools and consumables.
The company’s strategy also makes sense for long-term expansion. It has built a portfolio that combines everyday research products with more specialized platforms. That is important because consumables and reagents can provide recurring sales, while higher-end platforms and diagnostics can expand the company’s role in customer workflows. Bio-Techne has also used acquisitions over time to enter adjacent categories and strengthen its presence in advanced analysis and therapy-enabling tools.
Growth has clearly slowed from the strong post-pandemic period. Year-over-year revenue gains were once above 20%, but more recent quarters have mostly been in the low single digits, with a brief period of contraction before turning slightly positive again. This does not point to a broken business, but it does show that Bio-Techne is currently in a slower phase than many investors once expected.
Cash generation has been steadier than headline earnings. Free cash flow has remained positive throughout the period shown, and the recent level is stronger than the trough seen during the weaker operating phase. For a company serving research and diagnostic markets, that is a useful sign because it suggests the underlying business still converts a meaningful share of revenue into cash even when conditions are uneven.
A meaningful catalyst is the company’s positioning in spatial biology and cell and gene therapy workflows. These are areas where customers need more precise tools and where switching costs can be higher once a platform or workflow is adopted. Another catalyst is margin normalization: if Bio-Techne can keep revenue growing modestly while protecting costs better than it did in fiscal 2025, profit growth can outpace sales growth. Recent company communications in fiscal 2026 pointed to improving execution, portfolio focus, and better profitability, which supports that possibility.
Risks
This article is for informational purposes only and does not constitute financial advice. Some content is AI-generated. See Disclaimer


