Stock Analysis · Tecan Group Ltd (TCGGY)
Overview
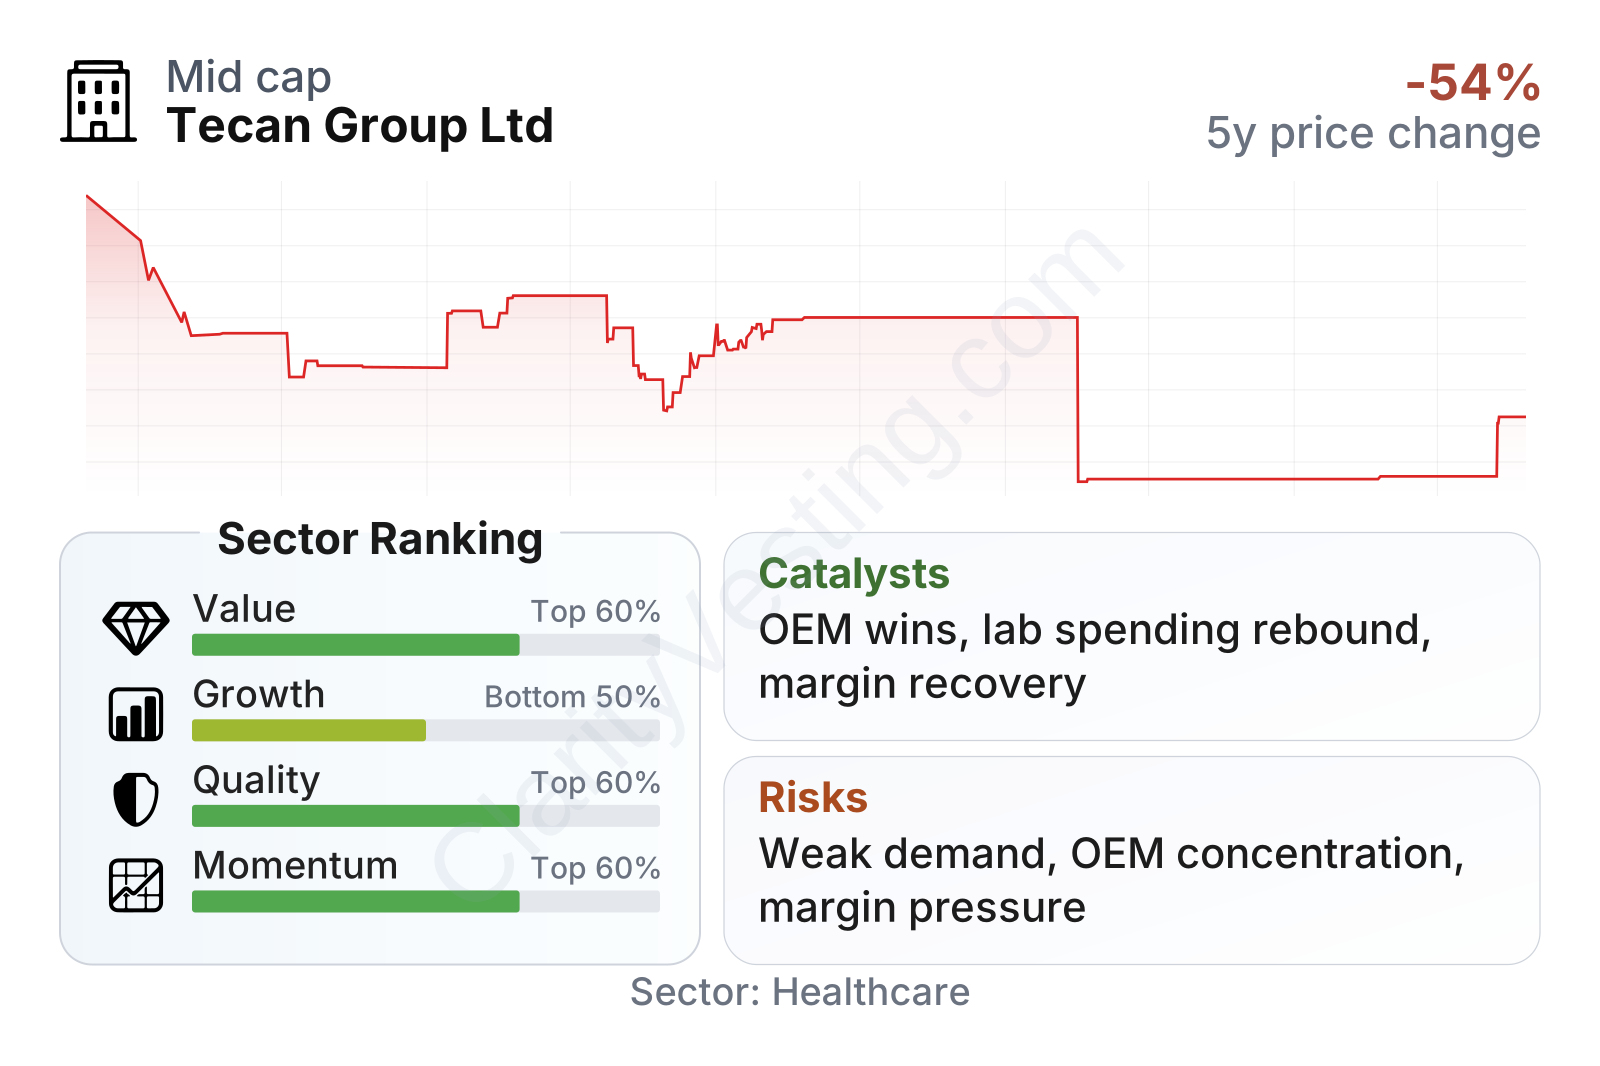
Tecan Group Ltd is a Swiss life sciences and laboratory technology company focused on automating work inside research, diagnostic, and biopharmaceutical labs. In simple terms, it builds instruments, software, and related consumables that help labs handle samples more precisely and with less manual work. Its systems are used in areas such as drug discovery, clinical diagnostics, genomics, and laboratory testing. The business also has an important partnership model: beyond selling under its own brand, Tecan designs and manufactures instruments and components that other healthcare and diagnostics companies sell as part of their own solutions.
The company reports two main business segments, which are also the clearest way to understand where revenue comes from.
- Partnering Business: approximately 55% to 60% of revenue in recent years. This segment develops and manufactures OEM instruments, components, and subsystem solutions for large diagnostics, life science, and medtech companies. It is typically tied to longer customer relationships and can benefit when partners launch new platforms.
- Life Sciences Business: approximately 40% to 45% of revenue in recent years. This includes automated liquid handling platforms, laboratory instruments, software, service, and recurring consumables sold more directly to research, biopharma, and diagnostic laboratories.
Within those segments, a meaningful part of sales is recurring after the initial instrument installation, especially from services, consumables, and replacement parts, although the company does not always break this out with one single percentage in a way that allows a precise current-year figure. Geographically, Tecan is broadly diversified across Europe, North America, and Asia, which reduces dependence on one healthcare market but also exposes it to different funding cycles and regional demand swings.
Operationally, Tecan sits in an attractive niche: it is not a mass-market medical device company, but a specialized provider of tools that can become embedded in customer workflows. That tends to support customer stickiness once a platform is validated and integrated into a laboratory process.
The financial flow over the last several years shows a business that expanded strongly in 2022, then faced a multi-year slowdown. Revenue moved down from the 2022 peak through 2025, while operating profit compressed much more sharply, indicating that lower volume and less favorable mix had a strong effect on margins. Even so, research and development spending remained substantial, which suggests Tecan kept investing in its platform base despite weaker conditions.
Key Figures
| Metric | Value | Sector ⓘ |
|---|---|---|
| Date | Oct 24, 2026 | |
| Context | ||
| Sector | Healthcare | |
| Industry | Medical Instruments & Supplies | |
| Market Cap ⓘ | $3.23B | |
| Beta ⓘ | 1.01 | |
Value (Cheapness) | ||
| P/E Ratio ⓘ | N/A | 25.42 |
| P/B Ratio ⓘ | 2.91 | 3.08 |
| FCF Yield ⓘ | 6.46% | 3.12% |
| Dividend Yield ⓘ | 1.46% | 1.85% |
| EBIT / EV ⓘ | N/A | 0.56% |
| PEG ⓘ | N/A | |
Growth (Business expansion) | ||
| Revenue Growth ⓘ | -2.70% | 7.50% |
| RPS Growth (5Y CAGR) ⓘ | -2.41% | 8.60% |
| EPS Growth (5Y CAGR) ⓘ | -13.41% | -17.73% |
| BVPS Growth (5Y CAGR) ⓘ | -2.20% | 3.72% |
| Margin Growth (5Y Trend) ⓘ | -12.29% | -0.57% |
| FCF Growth (5Y CAGR) ⓘ | -5.01% | 0.96% |
| DPS Growth (5Y CAGR) ⓘ | 7.59% | 6.69% |
Quality (Business durability) | ||
| ROIC (Latest) ⓘ | 6.57% | 3.17% |
| ROA (Latest) ⓘ | -2.77% | 2.98% |
| ROIC (5Y Median) ⓘ | 6.10% | 4.56% |
| ROA (5Y Median) ⓘ | 5.89% | 1.87% |
| Net Debt / EBIT (Latest) ⓘ | 0.79 | 1.34 |
| Net Debt / EBIT (5Y Median) ⓘ | 1.55 | 1.86 |
| Net Debt / EBITDA (Latest) ⓘ | 0.38 | 1.00 |
| Net Debt / Assets ⓘ | 5.45% | 5.06% |
| EBITDA / Interest ⓘ | N/A | 9.55 |
| Operating Margin (Latest) ⓘ | 6.43% | 9.25% |
| Operating Margin (5Y Median) ⓘ | 12.54% | 7.33% |
| Debt to Equity (Latest) ⓘ | 19.17% | 26.68% |
| Profit Margin (Latest) ⓘ | -13.36% | 3.34% |
| Free Cash Flow (Latest) ⓘ | $208.96M | |
Momentum (Price trend) | ||
| 3Y Return ⓘ | -16.46% | +51.61% |
| 12M Return (excl. last month) ⓘ | +48.93% | +19.90% |
| 6M Return ⓘ | +45.83% | +10.10% |
| Price vs. 200-Day MA ⓘ | +38.36% | +6.44% |
Tecan currently looks like a mid-sized healthcare equipment company with a balance sheet that remains relatively solid. Leverage is low by sector standards, cash generation is still meaningful, and free cash flow yield stands above the industry median. On the other hand, recent growth measures are weak: revenue has declined year over year, longer-term revenue per share trends are negative, and operating margins have fallen well below the company’s own historical level. The recent share-price rebound has been strong over the last six months, but that recovery comes after a very large decline from prior highs, so market confidence appears improved but not fully restored.
Growth
Tecan operates in a sector with favorable long-term drivers. Laboratory automation, molecular diagnostics, biologics development, and higher-throughput testing all support demand for equipment that can improve productivity and reproducibility. Over time, labs and diagnostics companies generally want to reduce manual handling, cut error rates, and process more samples with fewer labor constraints. That industry direction is positive for companies with proven automation platforms.
Tecan’s strategy also makes sense for that environment. Its direct life sciences business gives it exposure to academic research, biopharma, and clinical labs, while the partnering business links it to larger original equipment customers that can commercialize systems at scale. This dual model can be powerful because one side offers customer intimacy and product visibility, while the other can provide multi-year platform programs and deeper integration into end markets.
A potential catalyst is the eventual normalization of customer ordering after the post-pandemic digestion period that has affected many life science tools companies. Several parts of the industry have gone through a reset after unusually strong demand earlier in the decade, particularly in biotech funding, instrument purchasing, and some testing-related categories. If spending stabilizes, Tecan could benefit from both improving instrument demand and better utilization of its manufacturing base.
Another relevant growth angle is menu expansion around automation workflows rather than dependence on one flagship machine. Tecan’s solutions often combine instruments, software, and workflow-specific components. That can help the company deepen relationships over time and increase recurring revenue attached to installed systems.
Recent company updates have also highlighted restructuring and efficiency measures intended to simplify operations and protect profitability during a softer demand environment. While cost actions are not a growth engine by themselves, they can create a stronger base for future earnings recovery if revenue conditions improve. A meaningful upside scenario would come from new OEM platform wins, stronger biopharma demand, or improved laboratory capital spending across research and diagnostics customers.
Risks
This article is for informational purposes only and does not constitute financial advice. Some content is AI-generated. See Disclaimer


