Stock Analysis · Texas Capital Bancshares Inc (TCBI)
Overview
Texas Capital Bancshares is the parent company of Texas Capital, a Texas-based bank that serves businesses, entrepreneurs, and wealthy households. Its model is centered on commercial banking rather than mass-market consumer banking. That means the company mainly works with middle-market companies, commercial real estate clients, institutional customers, and private wealth relationships. In recent years, management has also been building fee-based businesses such as investment banking, treasury services, and wealth-oriented offerings to reduce reliance on traditional lending spreads.
Like most banks, Texas Capital earns money from a mix of interest income and fees. The largest source is typically net interest income, which is the spread between what it earns on loans and securities and what it pays on deposits and other funding. Based on recent annual reporting trends, revenue is primarily tied to core banking activity, with non-interest income still meaningful but clearly smaller.
- Net interest income: approximately 70% to 80% of total revenue in recent periods. This includes income from commercial loans, mortgage finance, securities, and balances placed with other institutions, minus interest paid on deposits and borrowings.
- Non-interest income: approximately 20% to 30%. This includes service charges, investment banking and advisory-related activity, treasury products, trading-related revenue, and other banking fees.
- Geographic concentration: heavily Texas-focused, with business tied to one of the fastest-growing large state economies in the U.S. That concentration is both part of the opportunity and part of the risk profile.
The business has become more diversified than a plain regional lender, but it is still fundamentally a commercial bank whose results depend on loan demand, deposit pricing, credit quality, and the shape of interest rates.
The multi-year profit flow shows a business that expanded revenue strongly, but profitability was uneven as funding costs and interest expense surged during the higher-rate period. The rebound after 2024 suggests earnings are highly sensitive to margin conditions rather than driven only by steady fee growth.
Key Figures
| Metric | Value | Sector ⓘ |
|---|---|---|
| Date | Oct 24, 2026 | |
| Context | ||
| Sector | Financial Services | |
| Industry | Banks - Regional | |
| Market Cap ⓘ | $4.29B | |
| Beta ⓘ | 0.63 | |
Value (Cheapness) | ||
| P/E Ratio ⓘ | 12.85 | 12.46 |
| P/B Ratio ⓘ | 1.24 | 1.25 |
| FCF Yield ⓘ | 21.56% | 9.82% |
| Dividend Yield ⓘ | 0.21% | 2.94% |
| EBIT / EV ⓘ | 32.70% | 8.11% |
| PEG ⓘ | 1.47 | |
Growth (Business expansion) | ||
| Revenue Growth ⓘ | 8.60% | 9.10% |
| RPS Growth (5Y CAGR) ⓘ | 22.87% | 12.31% |
| EPS Growth (5Y CAGR) ⓘ | 20.48% | -6.97% |
| BVPS Growth (5Y CAGR) ⓘ | 8.86% | 5.02% |
| Margin Growth (5Y Trend) ⓘ | -12.05% | -4.00% |
| FCF Growth (5Y CAGR) ⓘ | -14.59% | 4.71% |
| DPS Growth (5Y CAGR) ⓘ | 0.91% | 8.92% |
Quality (Business durability) | ||
| ROIC (Latest) ⓘ | 8.99% | 9.18% |
| ROE (Latest) ⓘ | 10.20% | 13.93% |
| ROA (Latest) ⓘ | 1.14% | 1.57% |
| ROIC (5Y Median) ⓘ | 4.18% | 7.80% |
| ROE (5Y Median) ⓘ | 8.35% | 12.15% |
| ROA (5Y Median) ⓘ | 0.70% | 1.28% |
| Net Debt / EBIT (Latest) ⓘ | -5.84 | 1.02 |
| Net Debt / EBIT (5Y Median) ⓘ | -6.67 | 0.72 |
| Net Debt / EBITDA (Latest) ⓘ | -5.23 | 0.88 |
| Operating Margin (Latest) ⓘ | 24.85% | 22.30% |
| Operating Margin (5Y Median) ⓘ | 22.20% | 24.50% |
| Debt to Equity (Latest) ⓘ | 13.97% | 59.34% |
| Profit Margin (Latest) ⓘ | 28.70% | 26.42% |
| Free Cash Flow (Latest) ⓘ | $926.03M | |
Momentum (Price trend) | ||
| 3Y Return ⓘ | +84.08% | +95.73% |
| 12M Return (excl. last month) ⓘ | +11.12% | +17.30% |
| 6M Return ⓘ | -3.27% | +6.07% |
| Price vs. 200-Day MA ⓘ | +0.50% | +5.36% |
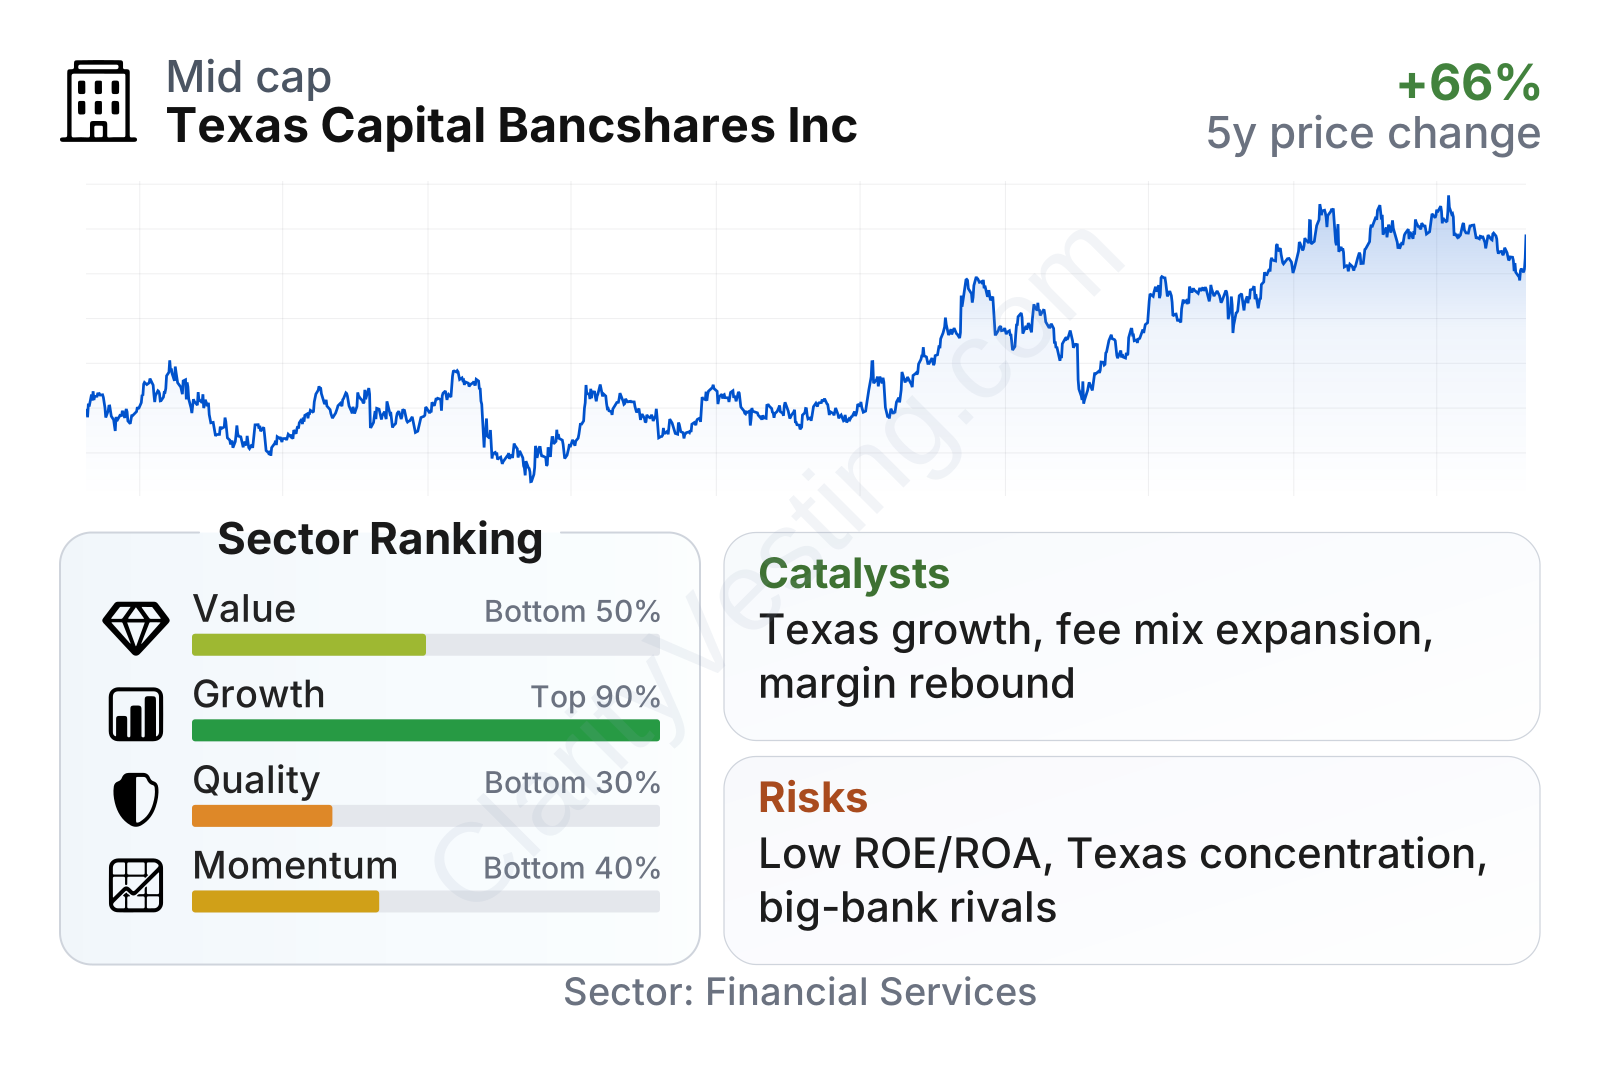
The overall picture is mixed. Growth measures are stronger than much of the regional banking group, especially over five years for revenue per share and book value per share. Valuation metrics sit close to sector norms, slightly on the lower side on earnings and book value. The weaker area is quality, where profitability ratios remain below many peers, and recent share-price momentum has lagged the broader regional bank group.
The stock’s path over the last several years reflects that mixed profile. It has recovered materially from the 2023 regional banking stress period and has climbed well above 2021 levels, but that rise came with sharp swings. Texas Capital is mid-sized in market value for a regional bank, and its beta below 1 suggests lower market sensitivity than many stocks, although bank-specific earnings cycles still matter a lot.
Growth
Texas Capital operates in a sector with steady long-term relevance, but not one that grows automatically. Regional banking expands when population growth, business formation, commercial activity, and client wallet share all move in the right direction. On that front, the company benefits from its home market: Texas remains one of the strongest large state economies in the country, with continued population gains, corporate relocations, infrastructure investment, and commercial development. That backdrop supports demand for commercial loans, treasury management, private wealth, and capital markets services.
The company’s strategy also makes sense for future growth because it is not relying only on balance-sheet expansion. Management has been trying to build a broader platform around commercial clients, adding fee-generating businesses that can deepen relationships and improve earnings durability over time. For a bank like Texas Capital, that matters because pure spread income can swing sharply when deposit costs rise faster than asset yields. A broader mix of treasury services, investment banking, and wealth activity can help smooth some of that pressure.
Earnings have been volatile rather than linear. The sharp drop in 2024 followed by a strong rebound in 2025 shows the bank can recover quickly when margin conditions improve, but it also shows that growth is not yet consistently predictable. That makes future execution especially important: long-term progress depends on whether recent profitability improvement can be sustained rather than appearing as a one-year bounce.
Book value per share has trended upward over time, which is an important sign for a bank. Rising book value usually means the institution is retaining capital and building franchise value even when earnings fluctuate. Here, that trend has been healthier than the sector median over five years, suggesting the company has created balance-sheet value despite a difficult rate cycle.
A meaningful recent opportunity is the combination of improving profitability and a still-developing fee business mix. If the bank continues to stabilize funding costs while expanding higher-value client services, revenue growth could become less dependent on interest rate conditions alone. That is likely one of the clearest long-term catalysts for the company.
Risks
This article is for informational purposes only and does not constitute financial advice. Some content is AI-generated. See Disclaimer


