Stock Analysis · TP ICAP Group PLC (TCAPF)
Overview
TP ICAP Group PLC is a global market infrastructure and interdealer broker. In simple terms, it helps large financial institutions trade complex products such as interest rate instruments, credit products, foreign exchange, energy, commodities, and equities. Its role is usually not to take big balance-sheet risk itself, but to connect buyers and sellers, provide pricing information, and support trade execution and post-trade services.
The group operates through several business lines, with revenue mainly coming from broking and market infrastructure activities used by banks, asset managers, corporations, and other institutional clients. Based on recent annual reporting, the revenue mix is broadly structured as follows:
- Global Broking: about 55% to 60% — voice and hybrid broking across rates, FX, credit, equities, energy, and commodities. This is the company’s largest activity and the historical core of the group.
- Liquidnet: about 20% to 25% — electronic trading networks focused mainly on institutional clients, especially in equities and fixed income.
- Energy & Commodities / Oil Broking and related execution services: included within the broking base and meaningful on a standalone basis — supports trading in energy, environmental products, and commodities where relationships and market access matter.
- Parameta Solutions: about 10% to 15% — data, analytics, valuation, and workflow tools sold on a recurring basis. This is one of the most strategically important pieces because it is less transaction-driven than broking.
That structure matters for long-term analysis. Traditional broking can be cyclical and activity-dependent, while data and electronic execution businesses can support steadier growth and usually deserve higher valuation multiples when they scale well.
Over the last several years, the business appears to have improved its profit conversion. Revenue has moved up from roughly $1.8 billion in 2021 to above $2.3 billion in 2025, while operating income and net income have risen more clearly than sales. That suggests management has been extracting better efficiency from the platform, even though the business mix still includes lower-margin and market-sensitive activities.
The long-term pattern shows a company that is no longer purely a traditional interdealer broker. It is gradually becoming a broader market infrastructure platform with a growing mix of electronic execution and data services, which is an important shift for how the business may be valued over time.
Key Figures
| Metric | Value | Sector ⓘ |
|---|---|---|
| Date | Oct 17, 2026 | |
| Context | ||
| Sector | Financial Services | |
| Industry | Capital Markets | |
| Market Cap ⓘ | $3.03B | |
| Beta ⓘ | 0.29 | |
Value (Cheapness) | ||
| P/E Ratio ⓘ | 12.50 | 12.26 |
| P/B Ratio ⓘ | 1.63 | 1.23 |
| FCF Yield ⓘ | 11.36% | 10.40% |
| Dividend Yield ⓘ | 4.05% | 3.02% |
| EBIT / EV ⓘ | N/A | 8.14% |
| PEG ⓘ | 0.79 | |
Growth (Business expansion) | ||
| Revenue Growth ⓘ | 6.00% | 9.35% |
| RPS Growth (5Y CAGR) ⓘ | -0.76% | 12.19% |
| EPS Growth (5Y CAGR) ⓘ | -81.03% | -9.53% |
| BVPS Growth (5Y CAGR) ⓘ | -6.70% | 4.99% |
| Margin Growth (5Y Trend) ⓘ | 8.92% | -3.86% |
| FCF Growth (5Y CAGR) ⓘ | 46.17% | 4.81% |
| DPS Growth (5Y CAGR) ⓘ | 19.26% | 8.79% |
Quality (Business durability) | ||
| ROIC (Latest) ⓘ | 19.45% | 9.49% |
| ROE (Latest) ⓘ | 18.25% | 13.90% |
| ROA (Latest) ⓘ | 4.76% | 1.55% |
| ROIC (5Y Median) ⓘ | 5.70% | 7.86% |
| ROE (5Y Median) ⓘ | 5.04% | 12.17% |
| ROA (5Y Median) ⓘ | 1.82% | 1.30% |
| Net Debt / EBIT (Latest) ⓘ | -0.09 | 0.96 |
| Net Debt / EBIT (5Y Median) ⓘ | 0.70 | 0.73 |
| Net Debt / EBITDA (Latest) ⓘ | -0.07 | 0.92 |
| Operating Margin (Latest) ⓘ | 15.33% | 22.30% |
| Operating Margin (5Y Median) ⓘ | 8.21% | 24.63% |
| Debt to Equity (Latest) ⓘ | 57.96% | 58.56% |
| Profit Margin (Latest) ⓘ | 8.11% | 26.57% |
| Free Cash Flow (Latest) ⓘ | $344.31M | |
Momentum (Price trend) | ||
| 3Y Return ⓘ | +153.91% | +88.33% |
| 12M Return (excl. last month) ⓘ | +22.32% | +19.38% |
| 6M Return ⓘ | +20.15% | +4.75% |
| Price vs. 200-Day MA ⓘ | +8.92% | +3.50% |
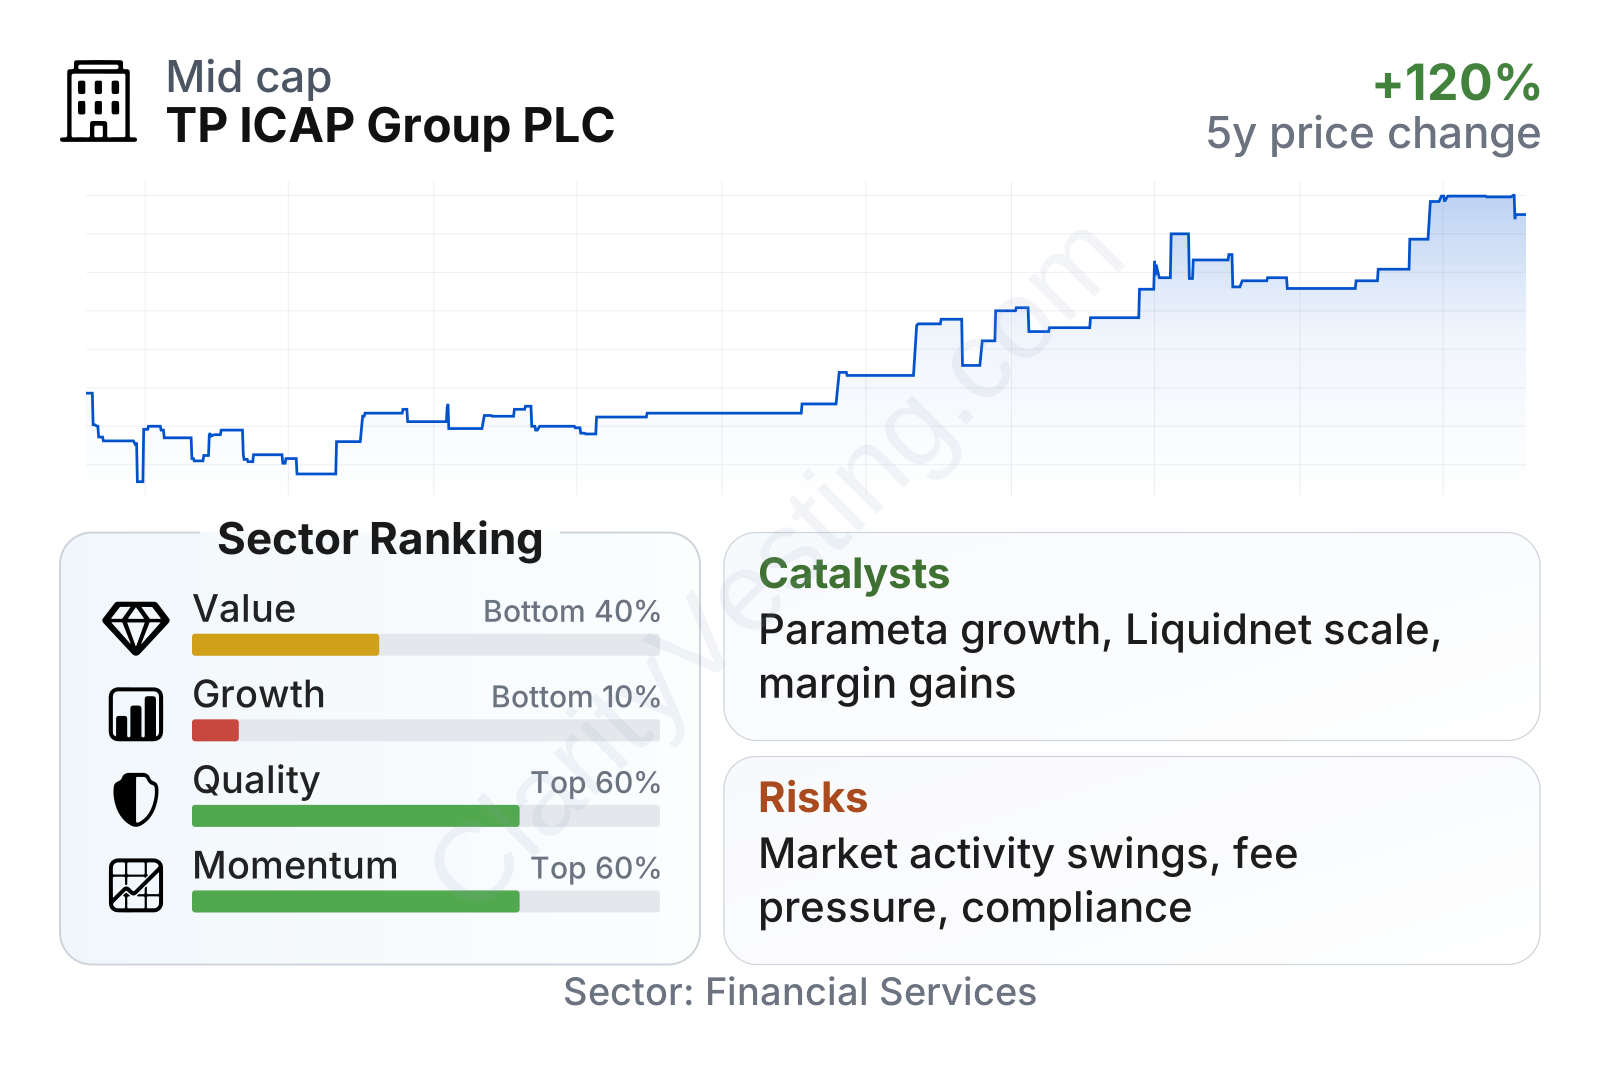
TP ICAP is a mid-sized financial services company with a market value in the low single-digit billions of dollars and a relatively low share price volatility profile compared with many financial stocks. The stock’s recent market performance has been strong, with gains over six months, one year, and three years running ahead of the sector median.
The factor picture is mixed but informative. Quality metrics are solid overall: recent returns on capital, equity, and assets are above sector medians, and leverage looks controlled, with net debt metrics currently better than many peers. Cash generation also stands out, helped by free cash flow that is strong relative to the company’s size.
The weaker area is growth. Recent revenue growth is positive, but the longer five-year record for revenue per share, earnings per share, and book value per share is weaker than the sector. That suggests the current improvement is real, but not yet enough to erase the uneven longer-term history. Value metrics also look mixed rather than clearly cheap, because the earnings multiple is only slightly above the sector median while the price-to-book multiple is much higher than the sector median.
Growth
TP ICAP operates in parts of the financial system that are likely to remain relevant for a long time. Trading in rates, FX, credit, and commodities is deeply embedded in the global economy, and rising regulation has increased the importance of transparent execution, workflow tools, pricing data, and post-trade infrastructure. That means the company is exposed to a sector with durable structural demand, even if yearly revenue can move around with market activity.
The key question is not whether markets will continue to exist, but whether TP ICAP can shift enough of its business toward higher-quality revenue streams. On that point, the strategy makes sense. Management has been building electronic trading capabilities and expanding Parameta Solutions, which provides data and analytics. Those areas are attractive because they can be more scalable, less dependent on individual brokers, and potentially more resilient than voice-only broking.
Liquidnet also gives TP ICAP access to institutional electronic trading, where clients increasingly want efficiency, lower information leakage, and cross-asset solutions. If the group can continue integrating its platforms and cross-selling data, execution, and workflow tools, growth could become more consistent and less tied to short-term trading volumes.
Book value per share has been uneven in recent years and fell sharply in the latest period shown, which is a reminder that headline growth is not perfectly smooth. Even so, the broader operating picture has improved. Operating margins have trended upward over the last five years, and free cash flow growth has been notably strong. In practical terms, the business seems to be extracting more profit and cash from each dollar of revenue than it did earlier in the cycle.
An important catalyst is the continuing expansion of higher-margin businesses inside the group. Data and analytics can carry a very different economic profile from broking, and market infrastructure assets often become more valuable as they gain scale and become embedded in client workflows. Another catalyst is volatility itself: when rates, currencies, credit, or energy markets become more active, trading volumes and client demand for execution and information services can rise.
Recent company reporting has also pointed to ongoing execution around productivity, technology investment, and shareholder distributions. While distributions are not the main growth engine, they can signal confidence in cash generation when backed by operating improvement rather than financial engineering.
Risks
This article is for informational purposes only and does not constitute financial advice. Some content is AI-generated. See Disclaimer


