Stock Analysis · The Bancorp Inc (TBBK)
Overview
The Bancorp, Inc. is a specialized financial company built around banking-as-a-service, payment infrastructure, and niche lending. Instead of operating like a traditional branch-heavy regional bank, it provides the regulated banking engine behind many fintech programs and payment products. Its bank subsidiary supports prepaid and debit card programs, ACH and other payment services, deposit accounts, and a set of lending businesses that include securities-backed lines of credit, small business lending, and selected real estate bridge activity.
This business mix matters because The Bancorp is tied to several long-running themes in finance: the shift from cash to digital payments, the outsourcing of banking functions by fintech firms, and demand for specialized lending products that large banks do not always prioritize. That makes the company look less like a plain regional bank and more like a hybrid of bank, payments platform, and specialty lender.
Based on recent annual disclosures, revenue is primarily generated from net interest income and non-interest income tied to payment and fintech-related services. A practical breakdown is:
- Net interest income: about 70% to 75% of total revenue. This is the spread between what the company earns on loans and securities and what it pays on deposits and other funding. It also reflects the large deposit base gathered through payments and fintech partnerships.
- Non-interest income: about 25% to 30% of total revenue. This includes card and payment-related fees, service fees from fintech and institutional partners, and other banking service income.
Within lending, the company’s specialty areas typically include securities-backed lending and small business lending, while the payments side is supported by prepaid, debit, and embedded banking programs. The combination gives The Bancorp multiple revenue streams, but the model still depends heavily on maintaining low-cost deposits and turning them into profitable assets.
Over the last several years, revenue and earnings have expanded materially, and profitability has remained strong even as expenses and funding costs increased. The broader pattern is that revenue grew much faster than overhead, allowing operating income and net income to climb meaningfully.
The long-term trend shows a business that scaled sharply from 2021 through 2024, with another year of solid profitability after that. Revenue growth moderated more recently, but margins remained unusually strong for a bank of this size.
Key Figures
| Metric | Value | Sector ⓘ |
|---|---|---|
| Date | Oct 17, 2026 | |
| Context | ||
| Sector | Financial Services | |
| Industry | Banks - Regional | |
| Market Cap ⓘ | $1.97B | |
| Beta ⓘ | 1.25 | |
Value (Cheapness) | ||
| P/E Ratio ⓘ | 9.34 | 12.26 |
| P/B Ratio ⓘ | 2.90 | 1.23 |
| FCF Yield ⓘ | 8.29% | 10.40% |
| Dividend Yield ⓘ | N/A | 3.02% |
| EBIT / EV ⓘ | 10.79% | 8.14% |
| PEG ⓘ | 1.07 | |
Growth (Business expansion) | ||
| Revenue Growth ⓘ | 0.40% | 9.35% |
| RPS Growth (5Y CAGR) ⓘ | 27.91% | 12.19% |
| EPS Growth (5Y CAGR) ⓘ | 6.23% | -9.53% |
| BVPS Growth (5Y CAGR) ⓘ | -39.88% | 4.99% |
| Margin Growth (5Y Trend) ⓘ | -0.22% | -3.86% |
| FCF Growth (5Y CAGR) ⓘ | 33.03% | 4.81% |
| DPS Growth (5Y CAGR) ⓘ | 17.18% | 8.79% |
Quality (Business durability) | ||
| ROIC (Latest) ⓘ | 24.71% | 9.49% |
| ROE (Latest) ⓘ | 31.27% | 13.90% |
| ROA (Latest) ⓘ | 2.60% | 1.55% |
| ROIC (5Y Median) ⓘ | 21.71% | 7.86% |
| ROE (5Y Median) ⓘ | 25.62% | 12.17% |
| ROA (5Y Median) ⓘ | 2.46% | 1.30% |
| Net Debt / EBIT (Latest) ⓘ | 3.08 | 0.96 |
| Net Debt / EBIT (5Y Median) ⓘ | -3.12 | 0.73 |
| Net Debt / EBITDA (Latest) ⓘ | 3.03 | 0.92 |
| Operating Margin (Latest) ⓘ | 40.65% | 22.30% |
| Operating Margin (5Y Median) ⓘ | 43.07% | 24.63% |
| Debt to Equity (Latest) ⓘ | 135.85% | 58.56% |
| Profit Margin (Latest) ⓘ | 43.61% | 26.57% |
| Free Cash Flow (Latest) ⓘ | $163.62M | |
Momentum (Price trend) | ||
| 3Y Return ⓘ | +40.16% | +88.33% |
| 12M Return (excl. last month) ⓘ | -34.62% | +19.38% |
| 6M Return ⓘ | -18.13% | +4.75% |
| Price vs. 200-Day MA ⓘ | -17.69% | +3.50% |
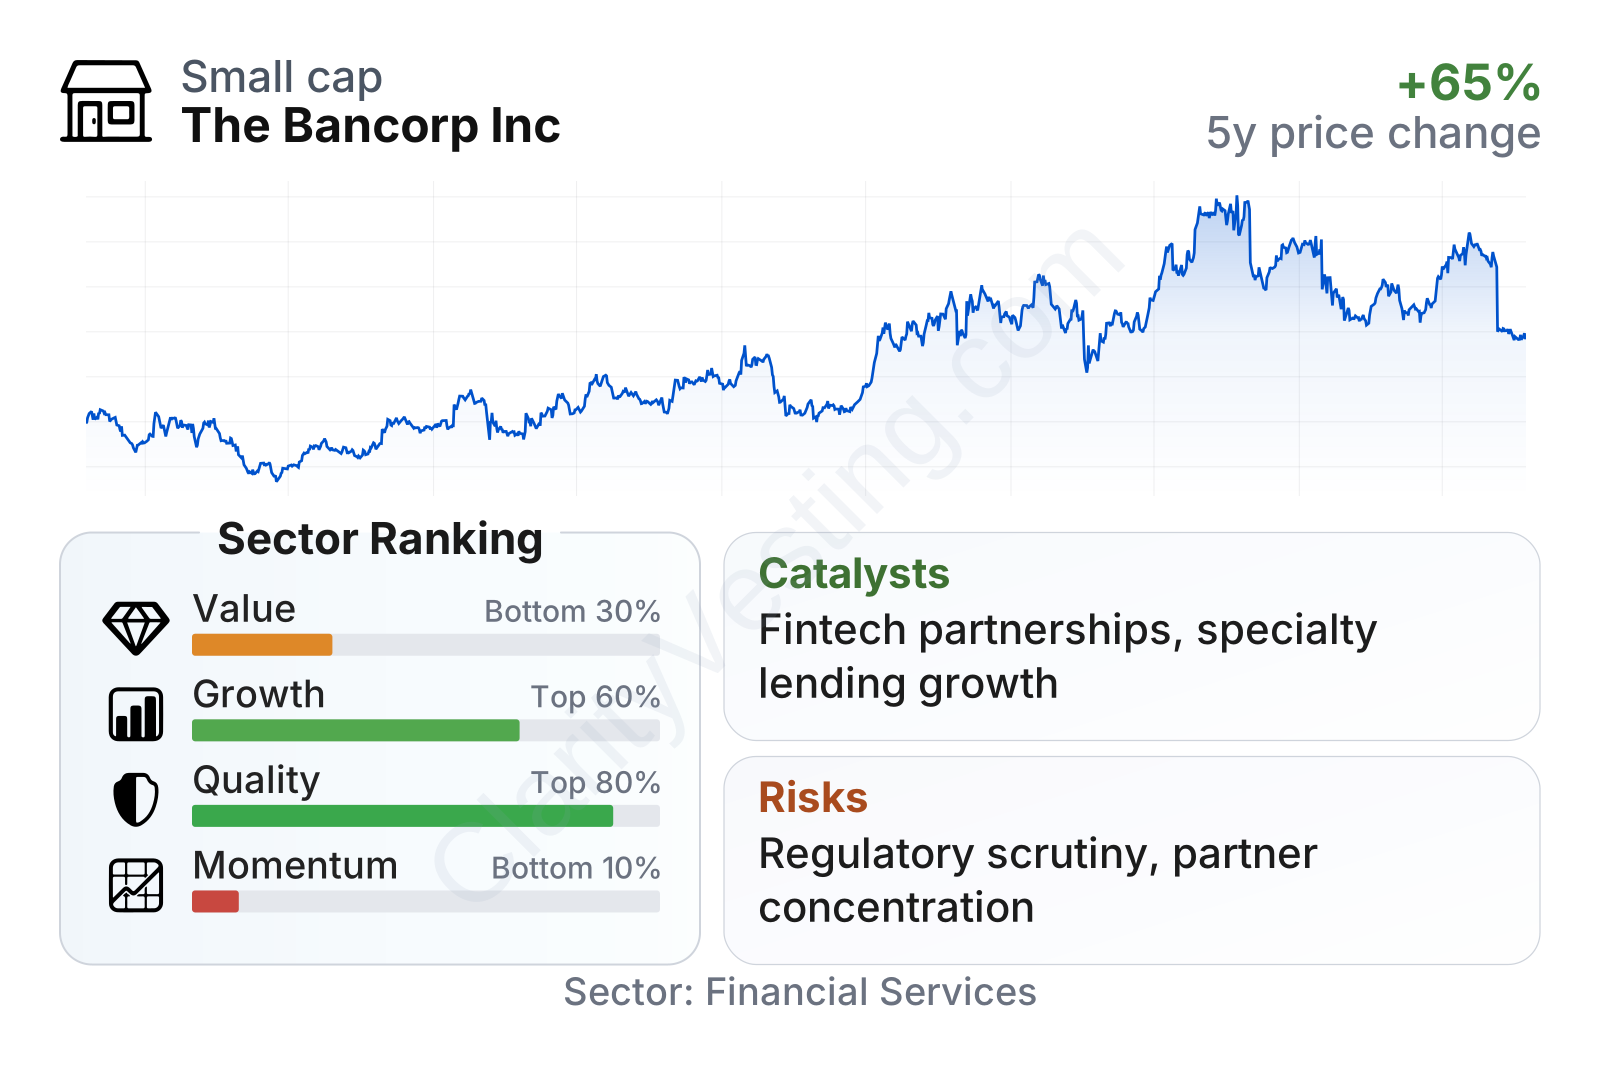
The company is still relatively small by market value compared with the broader financial sector, and the share price has been volatile. On valuation, earnings-based measures look lower than many peers, but balance-sheet-based measures look richer, reflecting the market’s willingness to pay more for its profitability. Quality metrics stand out: returns on equity and assets are well above sector medians, while momentum is currently weak after a softer stock run over the past year.
Growth
The Bancorp operates in parts of financial services that still have room to expand. Digital payments, embedded finance, and sponsor-bank relationships remain important structural trends. Many fintech companies need a regulated bank partner to offer cards, accounts, money movement, and related services. That creates a continuing role for specialized institutions that can manage compliance, program operations, and funding at scale.
The company’s strategy broadly fits that environment. It is not trying to win by building a large branch network. Instead, it focuses on infrastructure and specialized balance-sheet uses: gathering deposits through payment programs, placing those funds into loans and securities, and earning fees from partner activity. That approach can scale efficiently when partner programs grow, and it can produce stronger margins than more traditional regional banking models.
Earnings per share rose strongly from 2021 through 2025, which supports the idea that the business model has been compounding rather than merely benefiting from a one-time event. The pace appears to have cooled more recently, but the multi-year direction remains favorable.
Book value per share is less straightforward. After a sharp reset earlier in the period, it recovered and then leveled off. For a bank, that means earnings strength has been more visible than steady balance-sheet compounding, so future growth will need to come from sustained profitability, careful capital management, and disciplined underwriting rather than from simple asset expansion alone.
A notable catalyst is continued demand for banking partners from fintech and payments companies. If more programs migrate onto The Bancorp’s platform, deposits and fee income can grow together. Another potential driver is the company’s specialty lending portfolio, especially where it has underwriting expertise and pricing power. Public company updates in 2026 also pointed to continued operational execution rather than a major strategic break, which supports a picture of steady expansion instead of a turnaround.
Risks
This article is for informational purposes only and does not constitute financial advice. Some content is AI-generated. See Disclaimer


