Stock Analysis · Shenzhen International Holdings Limited (SZIHF)
Overview
Shenzhen International Holdings Limited is a Hong Kong-listed infrastructure operator focused on logistics and transport-related assets in China. Its business is built around assets that move goods: toll roads, logistics parks, port-related facilities, and supporting services. In simple terms, the company earns money from the physical backbone of freight movement, especially in the Greater Bay Area and other economically active parts of China.
The company’s revenue mix can shift from year to year because some activities are more recurring, such as toll roads and logistics operations, while others can be more project-based, including land development and asset-related transactions. Based on recent annual disclosures, the business is mainly supported by the following sources:
- Logistics and related infrastructure: approximately 55% to 70% of revenue in recent years. This includes logistics parks, warehousing, integrated logistics services, and port/logistics support activities.
- Toll road operations: approximately 15% to 30% of revenue. This segment collects road usage fees and benefits from freight traffic and regional transport demand.
- Land development and other businesses: approximately 10% to 20% of revenue, depending on project timing. This can include development-linked income and other supporting operations.
That mix matters because logistics assets and toll roads tend to be easier to understand for long-term analysis: both depend on freight volumes, regional economic activity, and the company’s ability to keep assets occupied and traffic flowing. The business model is asset-heavy, which usually means high upfront spending, meaningful debt, and cash flows that can be steadier than earnings in mature periods but more volatile during expansion phases.
Over the last several years, revenue has moved unevenly rather than in a straight line. Profitability has also been influenced by financing costs, taxes, and one-off swings around operating expenses. Even so, the company remains tied to long-duration infrastructure that can retain strategic value for a very long time if occupancy, traffic, and rental demand remain healthy.
The longer-term picture shows a business with fairly resilient gross profit generation, but with net results more exposed to interest expense and other below-the-line items. That is typical for leveraged infrastructure groups: the assets can be durable, but the financing structure has a large influence on shareholder outcomes.
Key Figures
| Metric | Value | Sector ⓘ |
|---|---|---|
| Date | Oct 17, 2026 | |
| Context | ||
| Sector | Industrials | |
| Industry | Infrastructure Operations | |
| Market Cap ⓘ | $2.21B | |
| Beta ⓘ | 0.90 | |
Value (Cheapness) | ||
| P/E Ratio ⓘ | 6.43 | 22.10 |
| P/B Ratio ⓘ | 0.06 | 1.97 |
| FCF Yield ⓘ | -450.18% | 6.38% |
| Dividend Yield ⓘ | 51.11% | 1.94% |
| EBIT / EV ⓘ | N/A | 4.79% |
| PEG ⓘ | N/A | |
Growth (Business expansion) | ||
| Revenue Growth ⓘ | 23.40% | 9.30% |
| RPS Growth (5Y CAGR) ⓘ | -5.23% | 7.81% |
| EPS Growth (5Y CAGR) ⓘ | -47.99% | -13.06% |
| BVPS Growth (5Y CAGR) ⓘ | -34.03% | 6.14% |
| Margin Growth (5Y Trend) ⓘ | -11.01% | 0.88% |
| FCF Growth (5Y CAGR) ⓘ | N/A | 11.01% |
| DPS Growth (5Y CAGR) ⓘ | -5.75% | 9.48% |
Quality (Business durability) | ||
| ROIC (Latest) ⓘ | N/A | 10.84% |
| ROA (Latest) ⓘ | 1.50% | 5.41% |
| ROIC (5Y Median) ⓘ | 3.97% | 9.38% |
| ROA (5Y Median) ⓘ | 1.56% | 4.95% |
| Net Debt / EBIT (Latest) ⓘ | 18.55 | 2.08 |
| Net Debt / EBIT (5Y Median) ⓘ | 7.97 | 2.27 |
| Net Debt / EBITDA (Latest) ⓘ | 7.15 | 1.39 |
| Net Debt / Assets ⓘ | 43.96% | 19.28% |
| EBITDA / Interest ⓘ | 3.63 | 9.58 |
| Operating Margin (Latest) ⓘ | 13.40% | 10.50% |
| Operating Margin (5Y Median) ⓘ | 22.94% | 10.29% |
| Debt to Equity (Latest) ⓘ | 216.75% | 65.48% |
| Profit Margin (Latest) ⓘ | 8.59% | 6.67% |
| Free Cash Flow (Latest) ⓘ | -$9.93B | |
Momentum (Price trend) | ||
| 3Y Return ⓘ | +35.58% | +61.68% |
| 12M Return (excl. last month) ⓘ | +104.55% | +12.58% |
| 6M Return ⓘ | +104.55% | 0.00% |
| Price vs. 200-Day MA ⓘ | +32.51% | +0.02% |
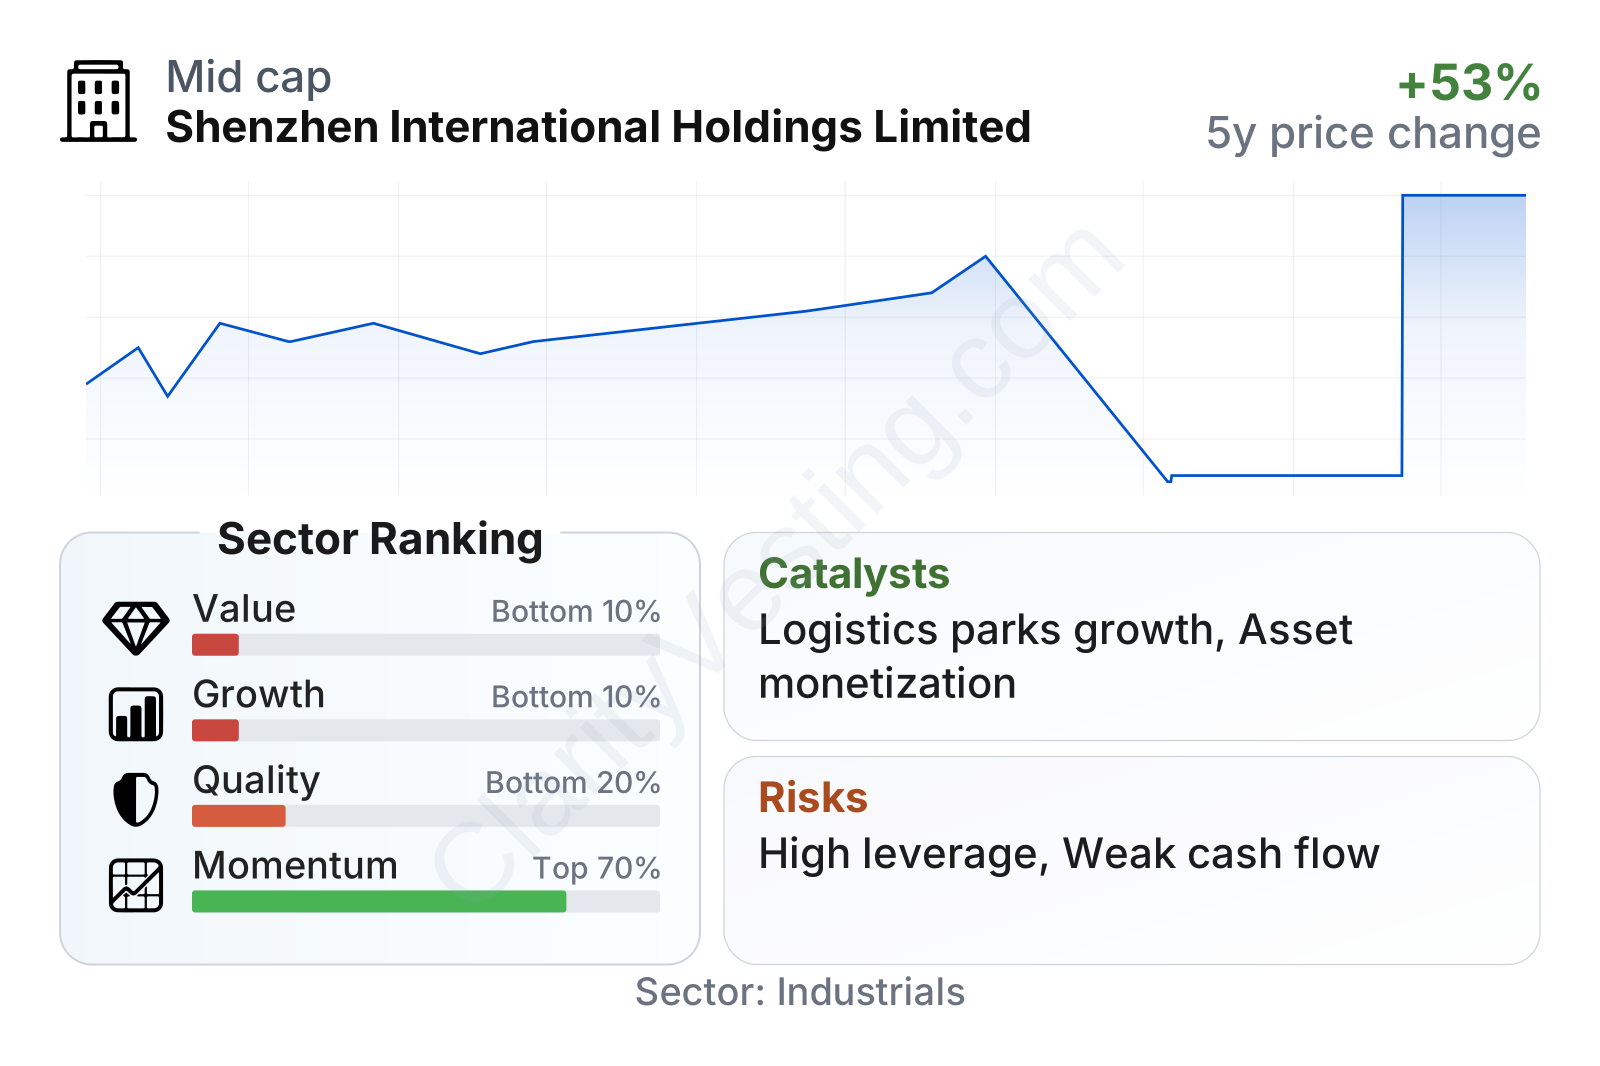
The current profile is mixed. On one hand, the shares screen as statistically cheap, with a low earnings multiple, a very low price-to-book ratio, and a dividend yield far above the sector median. On the other hand, the quality and growth rankings are weak compared with most industrial peers, mainly because leverage is high, returns on assets are modest, and longer-term earnings trends have been under pressure. Recent share-price momentum has been strong, but that strength has come after a long period in which the stock moved little and remained well below what stronger infrastructure franchises usually command.
The company is also mid-sized rather than dominant on a global scale, which matters because scale can help infrastructure operators refinance debt, win new projects, and spread operating costs. Its beta is below 1, suggesting the stock has not historically been more volatile than the broader market, but for a small over-the-counter name with concentrated China exposure, liquidity and trading behavior can still be uneven.
Growth
The company operates in a sector with durable long-term relevance. China continues to need freight corridors, modern warehouses, distribution hubs, and road networks that support e-commerce, manufacturing, and cross-regional trade. Even when the economy slows, logistics infrastructure remains essential. That does not guarantee fast growth, but it does support the strategic importance of the assets.
Its strategy broadly makes sense for future growth because it centers on logistics parks and transport infrastructure in economically significant areas, especially the Greater Bay Area. These assets can benefit from urbanization, industrial clustering, and the continuing need for more efficient goods movement. Logistics parks can also create a layering effect: warehousing, distribution, cold chain, and value-added services can all expand around the same land base over time.
A notable positive point is that recent year-over-year revenue growth has been stronger than the sector median. That suggests the company still has operating momentum in parts of the business despite weak long-term compounded growth metrics. In other words, near-term activity has improved faster than the five-year record would imply. If that improvement proves durable, it could matter more than the older trend line.
Another visible catalyst is the stock’s recent rerating. The share price was flat for months and then moved sharply higher in 2026, which often indicates that the market is reassessing either asset value, business momentum, or the possibility of a corporate event. For an infrastructure company trading at a deep discount to book value and a low earnings multiple, any sign of asset monetization, debt reduction, or simplification of the corporate structure can attract attention quickly.
Recent company communications have also continued to emphasize logistics infrastructure development, asset operations, and disciplined portfolio management. For a company like Shenzhen International, the most meaningful growth catalysts are not usually breakthrough technologies; they are more practical drivers such as higher road traffic, stronger warehouse demand, better occupancy, rental uplift, and the recycling of mature assets into new projects.
Risks
This article is for informational purposes only and does not constitute financial advice. Some content is AI-generated. See Disclaimer


