Stock Analysis · Stryker Corporation (SYK)
Overview
Stryker Corporation is a large medical technology company focused on products used in hospitals, surgery centers, and other healthcare settings. Its business is centered on orthopedic implants, surgical equipment, neurotechnology, and a wide range of devices that support procedures, patient handling, and emergency care. In simple terms, Stryker sells both the tools used during treatment and many of the implanted products that remain in the patient afterward.
The company’s revenue is spread across three main reporting segments. Based on its recent annual reporting structure, the mix is approximately as follows:
- MedSurg and Neurotechnology: about 46% of revenue. This includes surgical equipment, endoscopy, patient handling products, emergency medical equipment, communications systems, neurovascular devices, and cranial guidance technologies.
- Orthopaedics: about 35% of revenue. This includes knee and hip implants, trauma and extremities products, and bone cement used in reconstructive and injury-related procedures.
- Spine: about 19% of revenue. This includes spinal implant systems and related products used in spine procedures.
This mix matters because it gives Stryker more than one growth engine. Orthopedics benefits from aging populations and joint replacements, while the MedSurg and Neurotechnology portfolio broadens the company beyond pure implants and helps reduce dependence on a single procedure category.
The long-term financial picture also shows a business that has expanded meaningfully over the last several years. Revenue rose from about $17.1 billion in 2021 to about $25.1 billion in 2025, while operating income also moved higher. Gross profit increased faster than cost of revenue over that period, which points to a business that has been scaling with solid pricing power and operational discipline.
Key Figures
| Metric | Value | Sector ⓘ |
|---|---|---|
| Date | Nov 02, 2026 | |
| Context | ||
| Sector | Healthcare | |
| Industry | Medical Devices | |
| Market Cap ⓘ | $111.11B | |
| Beta ⓘ | 0.78 | |
Value (Cheapness) | ||
| P/E Ratio ⓘ | 31.08 | 25.09 |
| P/B Ratio ⓘ | 4.79 | 3.14 |
| FCF Yield ⓘ | 4.12% | 2.92% |
| Dividend Yield ⓘ | 0.28% | 1.70% |
| EBIT / EV ⓘ | 4.38% | 0.56% |
| PEG ⓘ | 1.37 | |
Growth (Business expansion) | ||
| Revenue Growth ⓘ | 7.60% | 7.30% |
| RPS Growth (5Y CAGR) ⓘ | 10.08% | 8.46% |
| EPS Growth (5Y CAGR) ⓘ | 1.32% | -17.34% |
| BVPS Growth (5Y CAGR) ⓘ | 10.80% | 3.71% |
| Margin Growth (5Y Trend) ⓘ | 5.09% | -0.61% |
| FCF Growth (5Y CAGR) ⓘ | 11.84% | 1.10% |
| DPS Growth (5Y CAGR) ⓘ | 7.83% | 6.66% |
Quality (Business durability) | ||
| ROIC (Latest) ⓘ | 10.38% | 5.22% |
| ROA (Latest) ⓘ | 7.62% | 2.99% |
| ROIC (5Y Median) ⓘ | 12.91% | 4.52% |
| ROA (5Y Median) ⓘ | 7.15% | 1.85% |
| Net Debt / EBIT (Latest) ⓘ | 2.01 | 1.34 |
| Net Debt / EBIT (5Y Median) ⓘ | 2.61 | 1.84 |
| Net Debt / EBITDA (Latest) ⓘ | 1.65 | 0.99 |
| Net Debt / Assets ⓘ | 23.08% | 5.33% |
| EBITDA / Interest ⓘ | 8.09 | 9.62 |
| Operating Margin (Latest) ⓘ | 20.59% | 9.33% |
| Operating Margin (5Y Median) ⓘ | 19.66% | 7.33% |
| Debt to Equity (Latest) ⓘ | 60.43% | 28.48% |
| Profit Margin (Latest) ⓘ | 13.78% | 3.44% |
| Free Cash Flow (Latest) ⓘ | $4.57B | |
Momentum (Price trend) | ||
| 3Y Return ⓘ | +11.25% | +55.56% |
| 12M Return (excl. last month) ⓘ | -24.68% | +16.75% |
| 6M Return ⓘ | -6.84% | +14.85% |
| Price vs. 200-Day MA ⓘ | -9.40% | +7.54% |
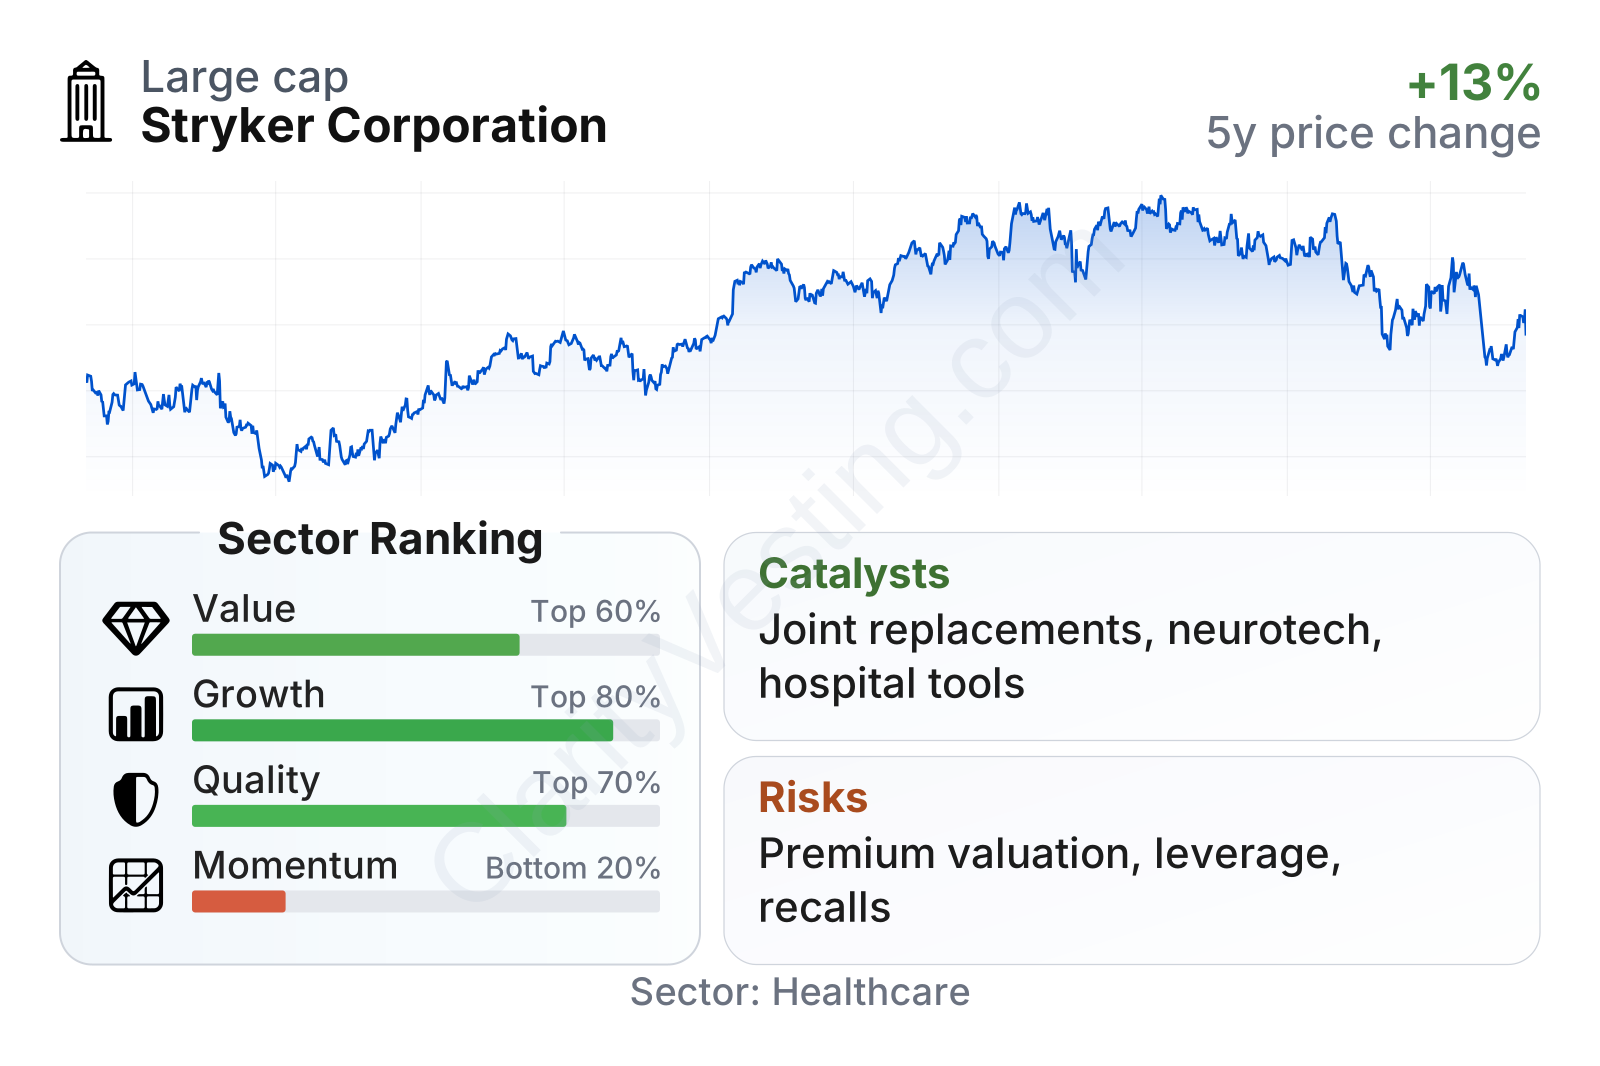
Stryker is a very large healthcare company with relatively low share-price volatility, as reflected by a beta below 1. Across the core business factors, the picture is strongest in growth and profitability rather than in cheapness. Revenue expansion has stayed ahead of much of the sector over multi-year periods, returns on capital are clearly above industry medians, and cash generation is solid. By contrast, the stock trades at valuation multiples above sector norms, while recent share-price momentum has been weak compared with peers.
Growth
Stryker operates in a part of healthcare that has durable structural support. Medical devices benefit from aging populations, rising rates of osteoarthritis and other musculoskeletal conditions, and a long-term increase in procedure demand as patients live longer and remain active later in life. Hospitals also continue to invest in productivity and workflow tools, which supports parts of Stryker’s MedSurg business beyond implants alone.
The company’s strategy appears coherent for future expansion because it combines steady demand categories with innovation and bolt-on acquisitions. Stryker has historically built scale in orthopedics while also expanding into higher-growth areas such as neurotechnology and medical-surgical equipment. That mix can help smooth performance when one procedure category slows.
Recent sales growth has remained positive, mostly in the high-single-digit to low-double-digit range over much of the past few years, with one softer quarter in early 2026 followed by reacceleration. That pattern suggests demand has not disappeared, but it also shows that growth is not perfectly linear and can be affected by procedure timing, hospital budgets, and comparisons with prior periods.
Cash generation has strengthened materially, with trailing free cash flow rising from roughly $2.5 billion in 2022 to about $4.6 billion more recently. For a medical device company, that is important: it supports research and development, acquisitions, debt servicing, and shareholder distributions without relying only on external financing.
A notable catalyst is the company’s broad installed base in hospitals. Once a supplier is embedded in surgical workflows, staff training, service contracts, and surgeon familiarity can support repeat demand. Another growth driver is procedure normalization and expansion in elective care, particularly in joint reconstruction. Product refreshes in robotics-assisted surgery, implants, neurovascular tools, and operating-room equipment can also create incremental opportunities if adoption continues.
Recent company communications and filings have also pointed to continued portfolio development through product launches and acquisitions. For Stryker, that matters because growth in this industry often comes from a combination of market expansion, share gains, and adding adjacent categories rather than relying on a single breakthrough product.
Risks
This article is for informational purposes only and does not constitute financial advice. Some content is AI-generated. See Disclaimer