Stock Analysis · Synchrony Financial (SYF)
Overview
Synchrony Financial is a consumer finance company focused mainly on private-label and co-branded credit cards, installment lending, and savings products. In simple terms, it helps retailers, health-care providers, and other partners offer financing to customers at the point of sale, while also gathering deposits through its online bank to fund part of its lending. The business sits at the intersection of payments, consumer credit, and partner-driven marketing.
The company’s revenue is largely tied to the loan balances it carries and the fees it earns from card and financing programs. Based on recent annual reporting, the main sources of revenue can be summarized as follows:
- Interest income on loans receivable: approximately 80% to 85%. This is the biggest driver and comes mainly from interest charged on credit card balances and installment loans.
- Retailer share arrangements and other partner-related payments: approximately 8% to 12%. These are economics shared with retail and commercial partners under program agreements and can reduce reported net revenue depending on contract structure.
- Interchange and network-related income, fees, and other financing income: approximately 5% to 10%. This includes transaction-related income, cardholder fees, and other servicing or program revenues.
- Deposit-related and ancillary items: a small share. Deposits are more important as a funding source than as a direct revenue engine.
Synchrony’s partner model is central to its identity. Rather than building a mass-market card brand around branches, it embeds credit products inside large retail, home, digital, and health-care ecosystems. That gives it broad customer reach, but also makes performance closely linked to consumer spending, credit quality, and the health of those partnerships.
Over the last several years, total revenue has moved higher overall, but the path has not been smooth. Higher interest expense became a much larger drag as rates climbed, which is important for a lender that relies heavily on funding costs and net interest margins. Even so, the company remained solidly profitable and recovered earnings after the pressure seen in 2023.
The business mix shows a lender with strong revenue generation capacity, but one that is naturally sensitive to funding costs. Revenue expanded materially from 2021 through 2024 before easing in 2025, while profitability improved again after the earlier squeeze from higher interest expense.
Key Figures
| Metric | Value | Sector ⓘ |
|---|---|---|
| Date | Oct 17, 2026 | |
| Context | ||
| Sector | Financial Services | |
| Industry | Credit Services | |
| Market Cap ⓘ | $23.34B | |
| Beta ⓘ | 1.34 | |
Value (Cheapness) | ||
| P/E Ratio ⓘ | 7.53 | 12.26 |
| P/B Ratio ⓘ | 1.46 | 1.23 |
| FCF Yield ⓘ | 41.54% | 10.40% |
| Dividend Yield ⓘ | 1.63% | 3.02% |
| EBIT / EV ⓘ | 18.24% | 8.14% |
| PEG ⓘ | 0.88 | |
Growth (Business expansion) | ||
| Revenue Growth ⓘ | 0.60% | 9.35% |
| RPS Growth (5Y CAGR) ⓘ | 25.84% | 12.19% |
| EPS Growth (5Y CAGR) ⓘ | -5.88% | -9.53% |
| BVPS Growth (5Y CAGR) ⓘ | 17.56% | 4.99% |
| Margin Growth (5Y Trend) ⓘ | -24.86% | -3.86% |
| FCF Growth (5Y CAGR) ⓘ | 8.54% | 4.81% |
| DPS Growth (5Y CAGR) ⓘ | 8.49% | 8.79% |
Quality (Business durability) | ||
| ROIC (Latest) ⓘ | 11.32% | 9.49% |
| ROE (Latest) ⓘ | 20.48% | 13.90% |
| ROA (Latest) ⓘ | 2.94% | 1.55% |
| ROIC (5Y Median) ⓘ | 11.54% | 7.86% |
| ROE (5Y Median) ⓘ | 22.48% | 12.17% |
| ROA (5Y Median) ⓘ | 2.98% | 1.30% |
| Net Debt / EBIT (Latest) ⓘ | 0.05 | 0.96 |
| Net Debt / EBIT (5Y Median) ⓘ | 0.59 | 0.73 |
| Net Debt / EBITDA (Latest) ⓘ | 0.05 | 0.92 |
| Operating Margin (Latest) ⓘ | 24.34% | 22.30% |
| Operating Margin (5Y Median) ⓘ | 24.17% | 24.63% |
| Debt to Equity (Latest) ⓘ | 97.25% | 58.56% |
| Profit Margin (Latest) ⓘ | 35.51% | 26.57% |
| Free Cash Flow (Latest) ⓘ | $9.69B | |
Momentum (Price trend) | ||
| 3Y Return ⓘ | +165.43% | +88.33% |
| 12M Return (excl. last month) ⓘ | +1.37% | +19.38% |
| 6M Return ⓘ | -1.75% | +4.75% |
| Price vs. 200-Day MA ⓘ | +0.43% | +3.50% |
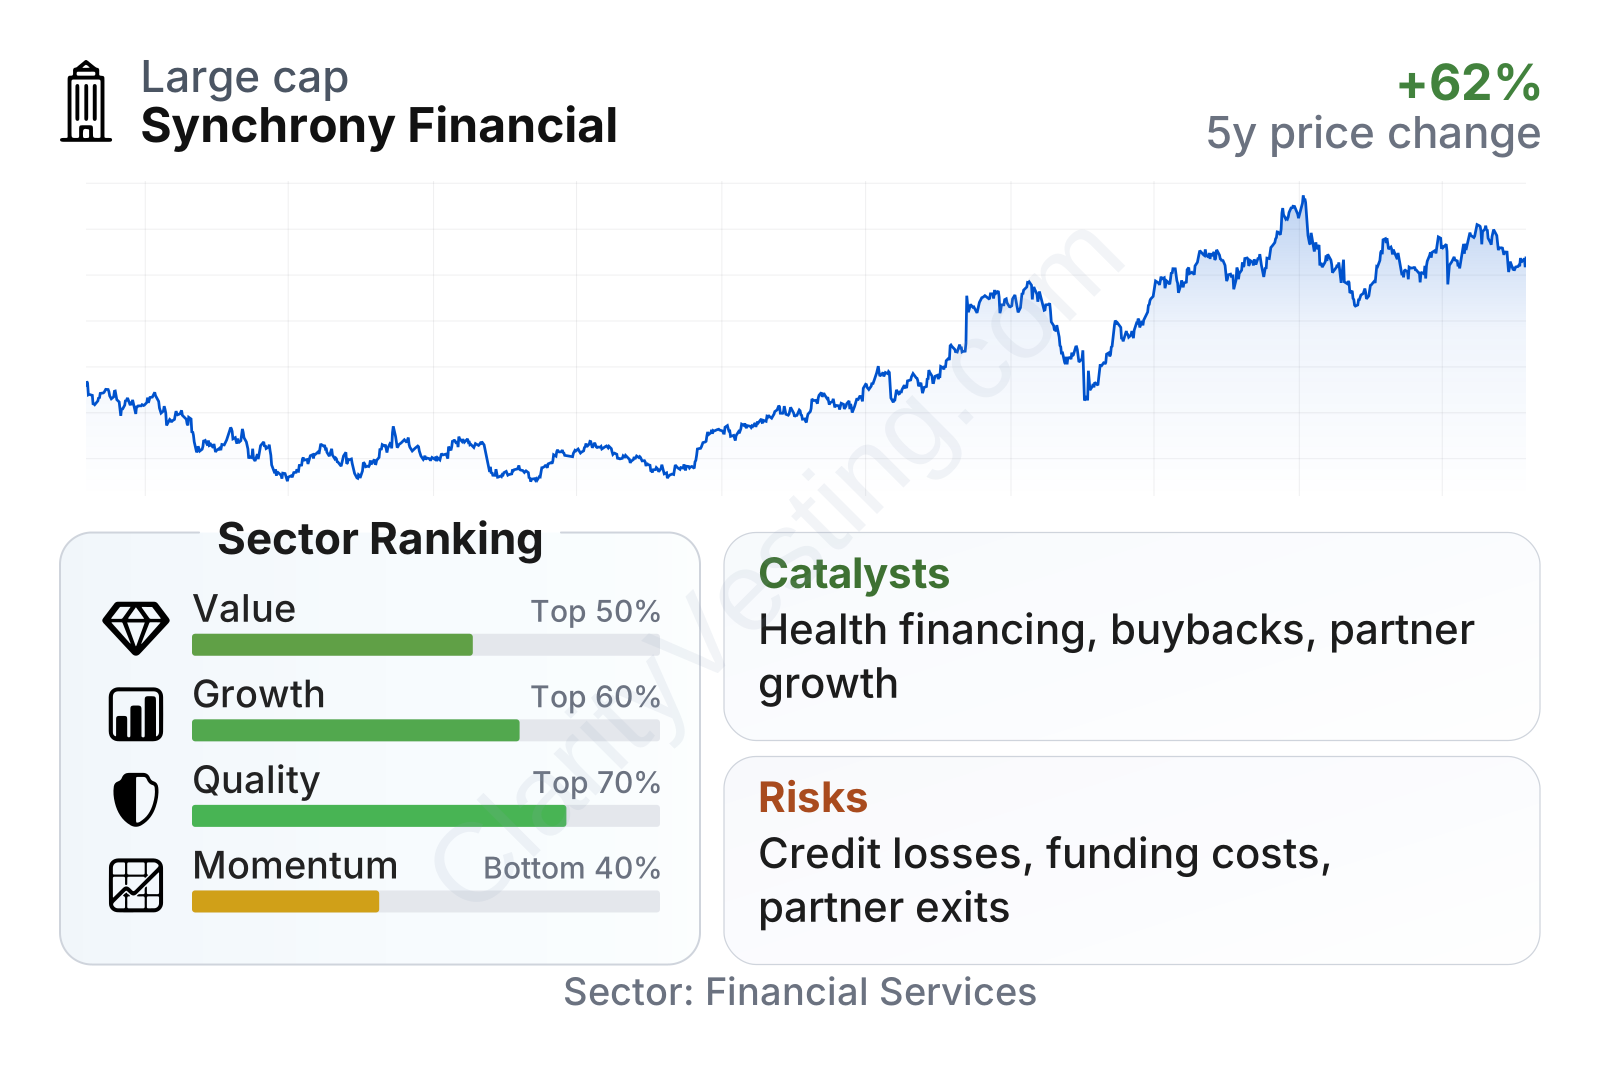
Synchrony is a large financial company with a market value in the tens of billions of dollars and a share price that has been volatile but strong over a three-year period. The table points to a mixed profile: valuation metrics look generally undemanding on earnings and cash flow, quality metrics are above sector medians, while recent growth and price momentum are less impressive. Profitability remains solid, with returns on equity and assets clearly above the sector median, but the market appears to be weighing that against slower near-term revenue growth and the normal cyclicality of consumer credit.
Growth
Synchrony operates in a sector with durable long-term demand. Consumers continue to use revolving credit, installment plans, and embedded financing for retail purchases, health care, home improvement, and larger everyday expenses. That does not make the sector a straight-line growth market, because demand depends on employment, spending, and credit conditions, but the broader trend toward digital checkout financing and partner-led payment ecosystems remains favorable.
The company’s strategy is coherent for this environment. It combines three useful pieces: large merchant partnerships, data-driven underwriting, and a deposit base that supports lending. This matters because partner finance programs can be sticky when they are deeply integrated into checkout systems and loyalty programs. It also matters because stable deposit funding can be more attractive than relying too heavily on wholesale markets.
Another encouraging point is the company’s ability to build value per share over time. Book value per share has risen strongly over the last five years, well ahead of the sector median growth rate. That suggests capital generation has remained meaningful even through a more difficult credit and rate cycle.
Earnings have been more cyclical than book value. EPS declined from 2021 through 2023, then rebounded in 2024 and rose sharply in 2025. This pattern fits a lender navigating higher funding costs and changing credit provisions rather than a structurally weakened franchise. The important question for long-term analysis is whether recent earnings represent a temporary high point or a healthier normalized level supported by loan growth, pricing, and operating discipline.
Recent company updates in 2026 continued to highlight loan receivables, purchase volume, and partner activity as key operating drivers. A significant opportunity for Synchrony is continued expansion in health and wellness financing, home, and digitally integrated payment programs, where consumers increasingly expect financing at checkout. Its scale in private-label and co-branded programs also creates room to deepen relationships with existing partners rather than relying only on winning new ones.
A further catalyst is capital return flexibility. When credit trends are manageable and capital remains strong, lenders like Synchrony can combine earnings with share repurchases and dividends, which can support per-share growth even when top-line expansion is moderate.
Risks
This article is for informational purposes only and does not constitute financial advice. Some content is AI-generated. See Disclaimer


