Stock Analysis · Stock Yards Bancorp Inc (SYBT)
Overview
Stock Yards Bancorp is a regional bank based in Kentucky and operating mainly through Stock Yards Bank & Trust. It provides traditional banking services to individuals, businesses, and wealth clients, with a footprint centered in Louisville, Lexington, and Cincinnati, along with specialty lending activities that extend beyond its branch markets. In simple terms, the company gathers deposits, makes loans, earns interest on those loans and securities, and also collects fees from services such as treasury management, trust, and wealth management.
Its revenue mix is still led by core banking income. Based on recent annual reporting, the largest source is net interest income, which is generated from the spread between what the bank earns on loans and securities and what it pays on deposits and borrowings. Noninterest income is the second source and includes wealth management, service charges, card-related fees, mortgage banking, and other banking fees.
The main sources of revenue can be summarized as follows:
- Net interest income: about 78% to 82% of total revenue in recent periods. This is the bank’s core engine and mainly reflects commercial real estate, commercial and industrial, residential real estate, and consumer lending, plus interest from securities.
- Wealth management, trust, and investment-related fees: about 6% to 9%. This includes trust administration, investment management, and related advisory services.
- Service charges, deposit account fees, and treasury management: about 4% to 7%. These are recurring fees attached to everyday banking relationships.
- Card, interchange, and other transaction-related fees: about 2% to 4%. These come from payment activity and account usage.
- Mortgage banking and other noninterest income: usually a smaller contribution, with the exact share varying depending on loan sales, market rates, and customer activity.
That mix matters for long-term analysis because Stock Yards is not only a plain deposit-and-loan bank. It also has fee income from wealth and trust operations, which can add some diversification when lending conditions are less favorable. Revenue has expanded meaningfully over the last several years, and profitability has remained solid despite higher funding costs across the banking sector.
The long-term picture shows a business that has grown revenue and net income at a healthy pace. One item around 2023 appears distorted by accounting presentation and does not match the company’s underlying earnings path, while the broader trend from 2021 through 2025 points to stronger scale and improving profits.
Key Figures
| Metric | Value | Sector ⓘ |
|---|---|---|
| Date | Oct 17, 2026 | |
| Context | ||
| Sector | Financial Services | |
| Industry | Banks - Regional | |
| Market Cap ⓘ | $2.34B | |
| Beta ⓘ | 0.75 | |
Value (Cheapness) | ||
| P/E Ratio ⓘ | 14.99 | 12.26 |
| P/B Ratio ⓘ | 1.97 | 1.23 |
| FCF Yield ⓘ | 6.30% | 10.40% |
| Dividend Yield ⓘ | 1.69% | 3.02% |
| EBIT / EV ⓘ | 9.70% | 8.14% |
| PEG ⓘ | 1.33 | |
Growth (Business expansion) | ||
| Revenue Growth ⓘ | 19.80% | 9.35% |
| RPS Growth (5Y CAGR) ⓘ | 19.19% | 12.19% |
| EPS Growth (5Y CAGR) ⓘ | -10.22% | -9.53% |
| BVPS Growth (5Y CAGR) ⓘ | 7.93% | 4.99% |
| Margin Growth (5Y Trend) ⓘ | -8.43% | -3.86% |
| FCF Growth (5Y CAGR) ⓘ | 12.10% | 4.81% |
| DPS Growth (5Y CAGR) ⓘ | 2.92% | 8.79% |
Quality (Business durability) | ||
| ROIC (Latest) ⓘ | 10.36% | 9.49% |
| ROE (Latest) ⓘ | 13.40% | 13.90% |
| ROA (Latest) ⓘ | 1.59% | 1.55% |
| ROIC (5Y Median) ⓘ | 10.50% | 7.86% |
| ROE (5Y Median) ⓘ | 13.31% | 12.17% |
| ROA (5Y Median) ⓘ | 1.34% | 1.30% |
| Net Debt / EBIT (Latest) ⓘ | 1.76 | 0.96 |
| Net Debt / EBIT (5Y Median) ⓘ | 1.18 | 0.73 |
| Net Debt / EBITDA (Latest) ⓘ | 1.66 | 0.92 |
| Operating Margin (Latest) ⓘ | 34.05% | 22.30% |
| Operating Margin (5Y Median) ⓘ | 31.56% | 24.63% |
| Debt to Equity (Latest) ⓘ | 35.42% | 58.56% |
| Profit Margin (Latest) ⓘ | 35.75% | 26.57% |
| Free Cash Flow (Latest) ⓘ | $147.33M | |
Momentum (Price trend) | ||
| 3Y Return ⓘ | +102.09% | +88.33% |
| 12M Return (excl. last month) ⓘ | +8.31% | +19.38% |
| 6M Return ⓘ | +8.08% | +4.75% |
| Price vs. 200-Day MA ⓘ | +5.39% | +3.50% |
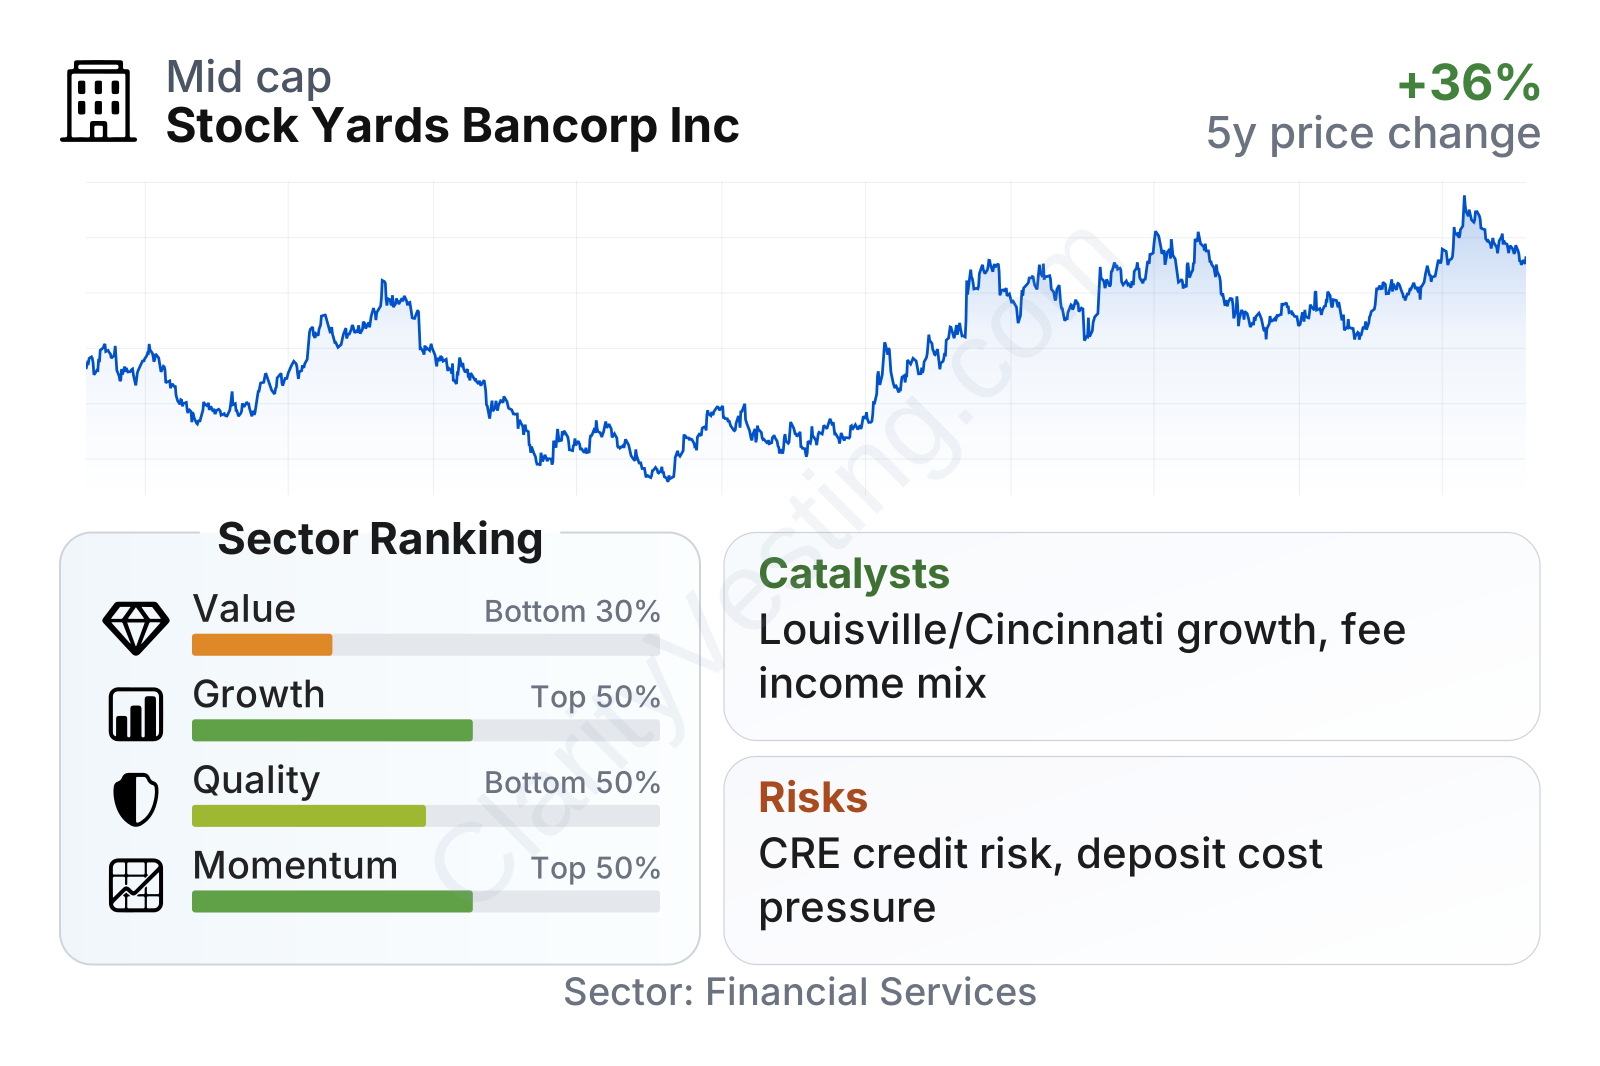
Stock Yards sits in the mid-cap range for regional banks and has shown lower share-price volatility than the broader market, which is consistent with a traditional banking model. The overall profile is mixed but understandable: growth and quality rank around the upper half of the sector, while value looks less attractive because the shares trade above typical regional-bank multiples. Profitability metrics remain healthy, with margins, return on assets, and long-term returns generally around or above sector norms, but the market is already recognizing much of that strength in the valuation.
The share-price history also shows a common regional-bank pattern: pressure during the 2023 banking stress period, followed by a strong recovery. More recently, momentum has improved over the last six months, although the longer 12-month pattern has been less impressive than many peers.
Growth
Stock Yards operates in a mature industry, so this is not a high-growth sector in the way software or semiconductors can be. However, regional banking can still produce durable expansion when a bank gains deposits, increases loans prudently, widens fee income, and acquires smaller institutions or specialty portfolios at sensible terms. In that context, Stock Yards has been growing in a part of the market where disciplined operators can still take share, especially in attractive metropolitan areas and specialized lending niches.
The company’s strategy appears coherent for long-term growth. It combines local relationship banking with specialty finance businesses and wealth management. That matters because pure loan growth can become volatile when interest rates change, while fee businesses and specialized client relationships can deepen customer retention. Management has also used acquisitions as a way to expand capabilities and geography rather than relying only on branch-by-branch organic growth.
Earnings per share have not followed a straight line, which is normal for banks in a period marked by fast rate changes and funding-cost pressure. Still, the multi-year picture is constructive: EPS moved from roughly the high-$3 range earlier in the decade to a clearly higher level by 2025. That suggests the franchise has been able to absorb industry shocks and still expand earnings over time.
Book value per share has also climbed steadily over the last several years, which is especially important for a bank. It indicates that the company has been building its capital base while continuing to earn solid returns. A rising book value alongside stable profitability usually signals that growth has not been purely cosmetic or dependent on excessive leverage.
A meaningful catalyst is the bank’s ability to keep expanding in higher-income and commercially active markets such as Louisville, Lexington, and Cincinnati, while also leveraging specialty lending and wealth-management relationships. Another favorable point is that recent revenue growth has been stronger than the sector median, and five-year revenue-per-share growth has also outpaced many peers. If deposit costs stabilize and loan demand remains healthy, operating leverage could improve further.
Recent company updates have also pointed to continued balance-sheet growth, loan production, and deposit gathering, which are central for a regional bank. None of that guarantees a step-change in results, but it supports the view that the company still has room to grow from its existing footprint and service model.
Risks
This article is for informational purposes only and does not constitute financial advice. Some content is AI-generated. See Disclaimer


