Stock Analysis · Southwest Gas Holdings Inc (SWX)
Overview
Southwest Gas Holdings Inc is primarily a regulated natural gas utility serving customers in fast-growing areas of the western and southwestern United States, especially Arizona, Nevada, and California. The group’s core business is delivering natural gas through local distribution networks to residential, commercial, and industrial customers. Because this is a regulated utility, a large part of its economics depends on state-approved rates, customer growth, infrastructure spending, and the ability to recover costs over time.
Following the separation of its utility infrastructure services business, Southwest Gas is now much more focused on the gas utility itself. That makes the company easier to understand than it was a few years ago: it is now largely a single-business utility centered on gas distribution, customer service, pipeline safety, and replacement of aging infrastructure.
The main revenue sources are concentrated in the utility operation. Based on recent company reporting, the revenue mix is approximately:
- Residential natural gas service: the largest category, driven by household heating and usage charges, plus fixed customer fees.
- Commercial natural gas service: businesses such as retail, offices, schools, and service providers.
- Industrial and other sales/transportation: larger-volume users and transportation services where the company moves gas through its network.
- Regulatory mechanisms and other utility revenue: items tied to infrastructure trackers, surcharges, and other approved recovery tools.
Because purchased gas costs are passed through to customers to a significant extent, headline revenue can move up or down with gas prices without saying much about the company’s underlying earning power. For a utility like Southwest Gas, customer growth, allowed returns, and capital investment usually matter more than raw sales levels.
There is also a geographic concentration in the Southwest. Arizona and Nevada are particularly important because they combine population growth with ongoing housing and business development, which can support long-term customer additions and system expansion.
The overall earnings picture has become cleaner after the portfolio simplification. Revenue has fluctuated with gas costs and business changes, but operating profitability has improved materially from the weak 2022 period, while interest expense remains a meaningful line to watch in a higher-rate environment.
Key Figures
| Metric | Value | Sector ⓘ |
|---|---|---|
| Date | Oct 17, 2026 | |
| Context | ||
| Sector | Utilities | |
| Industry | Utilities - Regulated Gas | |
| Market Cap ⓘ | $6.22B | |
| Beta ⓘ | 0.56 | |
Value (Cheapness) | ||
| P/E Ratio ⓘ | 21.48 | 17.28 |
| P/B Ratio ⓘ | 1.50 | 1.51 |
| FCF Yield ⓘ | -13.33% | 0.65% |
| Dividend Yield ⓘ | 2.94% | 3.77% |
| EBIT / EV ⓘ | 5.73% | 5.01% |
| PEG ⓘ | 1.86 | |
Growth (Business expansion) | ||
| Revenue Growth ⓘ | -9.60% | 6.10% |
| RPS Growth (5Y CAGR) ⓘ | -18.93% | 3.87% |
| EPS Growth (5Y CAGR) ⓘ | -6.86% | -11.30% |
| BVPS Growth (5Y CAGR) ⓘ | 2.38% | 4.23% |
| Margin Growth (5Y Trend) ⓘ | 17.57% | 3.57% |
| FCF Growth (5Y CAGR) ⓘ | -19.66% | -8.84% |
| DPS Growth (5Y CAGR) ⓘ | 1.42% | 4.84% |
Quality (Business durability) | ||
| ROIC (Latest) ⓘ | 5.20% | 6.53% |
| ROA (Latest) ⓘ | 4.99% | 3.20% |
| ROIC (5Y Median) ⓘ | 4.37% | 5.95% |
| ROA (5Y Median) ⓘ | 1.66% | 2.75% |
| Net Debt / EBIT (Latest) ⓘ | 6.09 | 7.13 |
| Net Debt / EBIT (5Y Median) ⓘ | 9.64 | 7.23 |
| Net Debt / EBITDA (Latest) ⓘ | 3.69 | 4.31 |
| Net Debt / Assets ⓘ | 30.92% | 38.42% |
| EBITDA / Interest ⓘ | 4.74 | 4.58 |
| Operating Margin (Latest) ⓘ | 30.55% | 20.83% |
| Operating Margin (5Y Median) ⓘ | 9.95% | 20.08% |
| Debt to Equity (Latest) ⓘ | 85.08% | 137.69% |
| Profit Margin (Latest) ⓘ | 31.40% | 11.37% |
| Free Cash Flow (Latest) ⓘ | -$829.39M | |
Momentum (Price trend) | ||
| 3Y Return ⓘ | +63.74% | +52.37% |
| 12M Return (excl. last month) ⓘ | +13.24% | +8.84% |
| 6M Return ⓘ | -5.32% | -3.95% |
| Price vs. 200-Day MA ⓘ | -1.76% | -0.79% |
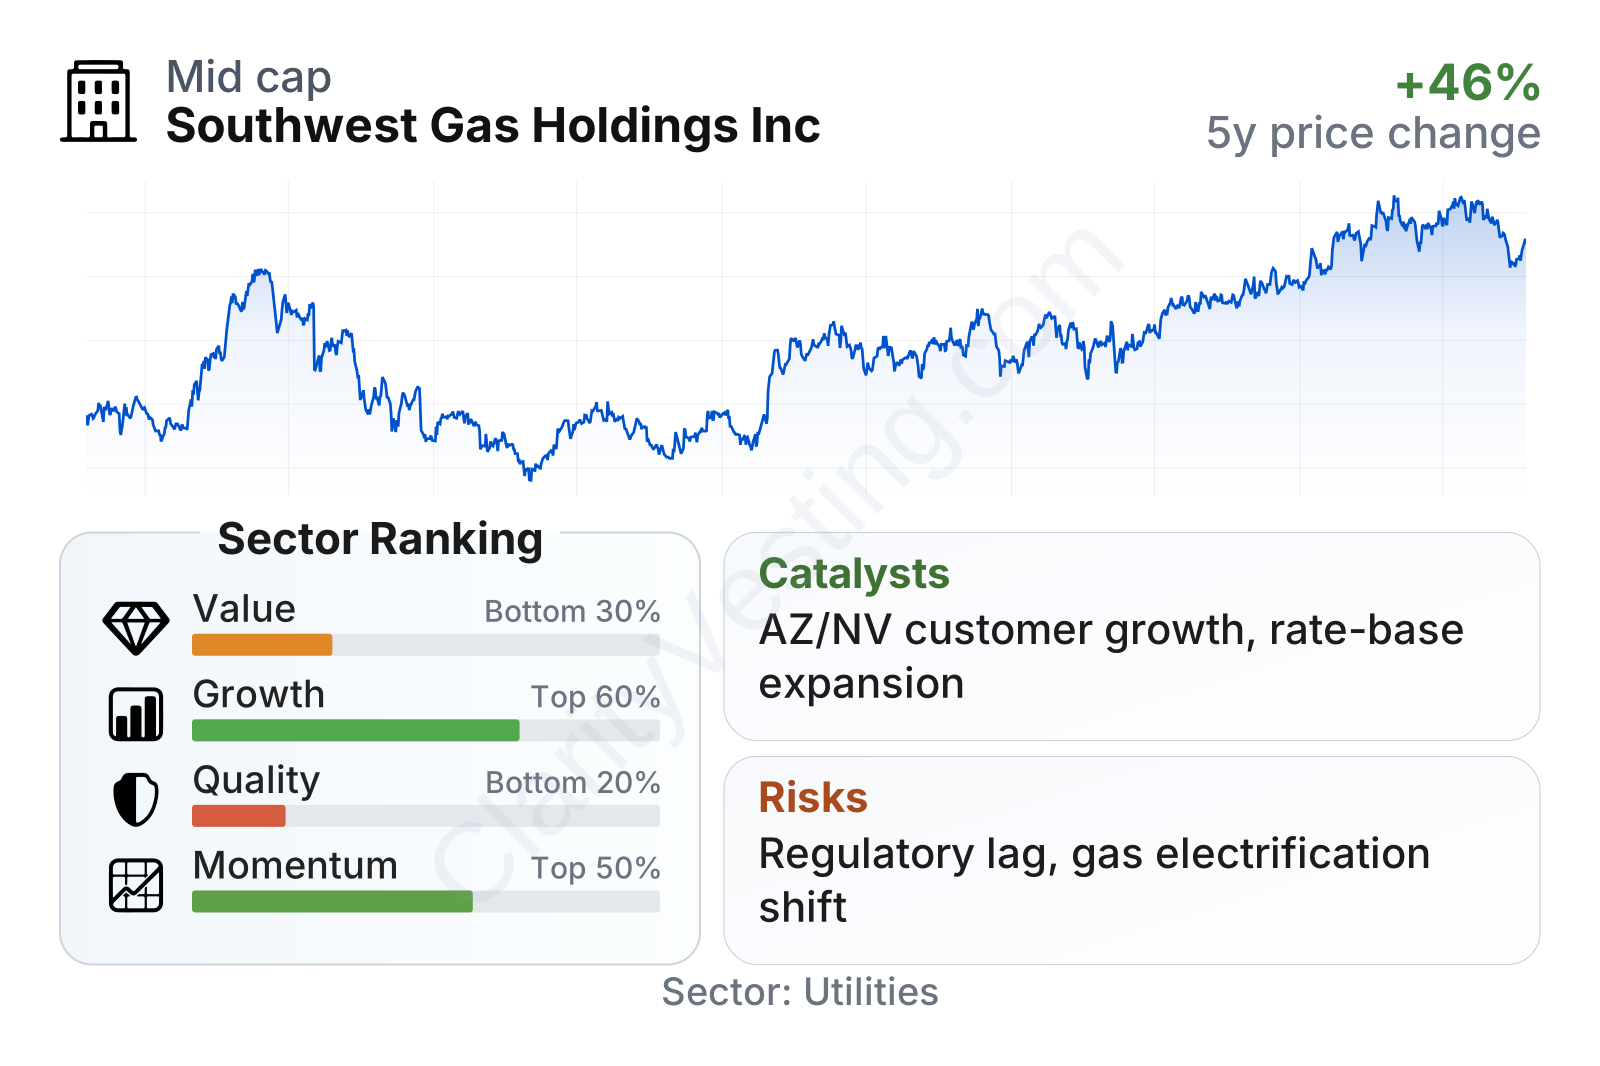
Southwest Gas stands out as a mid-sized utility with relatively low share-price volatility, which is typical for a regulated business. The broader picture is mixed: valuation measures sit below average compared with many utility peers, quality indicators are weighed down by weak recent profitability and negative free cash flow, while growth metrics reflect the transition period after asset changes rather than a simple steady expansion trend.
The stock’s multi-year performance has been constructive overall, although the path has not been smooth. Dividend yield is now around 3%, which is lower than the sector median, partly because the share price has risen. That means the income component is still present, but it is not the main reason the company stands out at the moment.
Growth
Southwest Gas operates in a mature sector, not a high-growth one. Regulated gas utilities usually grow through customer additions, capital investment, and approved rate increases rather than through rapid market share gains. In that context, Southwest Gas has a reasonable long-term setup because its service territory includes population-growth markets where new homes and businesses can expand the customer base over time.
The company’s strategy also makes sense after becoming more focused. A simpler structure can help management direct capital toward pipeline replacement, reliability, safety, and system modernization. Those projects matter because utilities can often earn a regulated return on approved investments, creating a fairly visible growth path if regulators remain supportive.
Revenue per share has been uneven rather than consistently rising. Part of that reflects changing gas costs and the business portfolio shift, so it should not be read in the same way as a consumer or industrial company’s sales trend. For Southwest Gas, a steadier indicator of future progress is whether customer counts, rate base, and authorized returns continue to move upward.
Free cash flow has been volatile and recently negative again, which is common in utilities during heavy infrastructure spending periods. Negative free cash flow is not automatically a warning sign in this sector if the spending is directed toward regulated assets that can support future earnings. The key question is whether the company can convert that spending into rate-base growth without putting too much pressure on the balance sheet.
A meaningful catalyst is continued population and housing growth in Arizona and Nevada. Another is the company’s ability to secure timely rate recovery for safety and replacement projects. In a utility model, that combination can gradually lift earnings even if overall gas demand grows only modestly. The portfolio simplification itself is also an opportunity because it reduces complexity and makes the business profile more comparable to other pure-play regulated utilities.
Recent company updates have also emphasized execution on utility infrastructure programs and regulatory proceedings. Those are not dramatic short-term events, but for a long-term utility analysis they are important because they shape future allowed earnings more directly than commodity prices do.
Risks
This article is for informational purposes only and does not constitute financial advice. Some content is AI-generated. See Disclaimer


