Stock Analysis · Skyworth Group Limited (SWDHF)
Overview
Skyworth Group Limited is a Chinese consumer electronics and technology company best known for televisions, set-top boxes, smart home devices, and products linked to digital living. Over time, the business has expanded beyond traditional TV hardware into smart systems, internet-connected appliances, commercial display products, and renewable-energy related operations. That mix gives the company exposure to both mature electronics categories and newer demand areas such as smart home ecosystems and distributed solar solutions.
Based on the company’s recent annual reporting structure, revenue mainly comes from a few broad business lines:
- Smart TV and related display products: approximately 45% to 55% of revenue. This includes televisions, display modules, and products tied to the home entertainment ecosystem.
- Smart systems and home access products: approximately 20% to 30%. This area generally includes set-top boxes, broadband and network access devices, commercial displays, and connected hardware sold to telecom and enterprise customers.
- New energy business: approximately 15% to 25%. This segment has become increasingly important and includes distributed photovoltaic activities and related energy solutions.
- Smart appliances and other businesses: approximately 5% to 10%. This covers products such as refrigerators, washing machines, air-conditioner related offerings, and other supporting operations.
That revenue mix matters because Skyworth is no longer only a television manufacturer. It is trying to use its brand, manufacturing base, and distribution network to build a broader electronics and energy platform, which can help reduce dependence on a single product cycle.
The long-term revenue picture shows a business that has grown meaningfully since 2021, but with profitability under pressure. Sales moved from roughly the low-50-billion range to the high-60-billion range in recent years, while net income fell sharply. In other words, the company has preserved scale, but converting that scale into durable earnings has become harder.
The operating profile suggests a high-volume, low-margin business. Cost of revenue has consistently absorbed most sales, leaving a relatively thin gross profit pool. Research and development spending has remained substantial, which supports product refresh and technology capability, but also limits short-term earnings when pricing conditions weaken.
Key Figures
| Metric | Value | Sector ⓘ |
|---|---|---|
| Date | Oct 03, 2026 | |
| Context | ||
| Sector | Technology | |
| Industry | Consumer Electronics | |
| Market Cap ⓘ | $1.31B | |
| Beta ⓘ | 1.11 | |
Value (Cheapness) | ||
| P/E Ratio ⓘ | 8.43 | 29.95 |
| FCF Yield ⓘ | -294.19% | 4.22% |
| Dividend Yield ⓘ | N/A | 1.30% |
| EBIT / EV ⓘ | N/A | 2.83% |
| PEG ⓘ | N/A | |
Growth (Business expansion) | ||
| Revenue Growth ⓘ | 4.90% | 15.80% |
| RPS Growth (5Y CAGR) ⓘ | 15.37% | 8.55% |
| EPS Growth (5Y CAGR) ⓘ | 12.45% | -11.72% |
| Margin Growth (5Y Trend) ⓘ | -0.88% | 0.39% |
| FCF Growth (5Y CAGR) ⓘ | N/A | 9.72% |
| DPS Growth (5Y CAGR) ⓘ | 44.18% | 7.73% |
Quality (Business durability) | ||
| ROIC (Latest) ⓘ | N/A | 9.36% |
| ROIC (5Y Median) ⓘ | 2.35% | 8.32% |
| Net Debt / EBIT (Latest) ⓘ | 5.95 | 0.50 |
| Net Debt / EBIT (5Y Median) ⓘ | 5.81 | 0.46 |
| Net Debt / EBITDA (Latest) ⓘ | 3.48 | 0.28 |
| Net Debt / Assets ⓘ | 12.74% | 3.44% |
| EBITDA / Interest ⓘ | 5.18 | 12.67 |
| Operating Margin (Latest) ⓘ | 1.49% | 9.81% |
| Operating Margin (5Y Median) ⓘ | 1.90% | 8.50% |
| Debt to Equity (Latest) ⓘ | 132.95% | 33.33% |
| Profit Margin (Latest) ⓘ | 1.19% | 7.15% |
| Free Cash Flow (Latest) ⓘ | -$3.85B | |
Momentum (Price trend) | ||
| 3Y Return ⓘ | +40.68% | +49.46% |
| 12M Return (excl. last month) ⓘ | +43.90% | +16.51% |
| 6M Return ⓘ | -30.59% | +24.29% |
| Price vs. 200-Day MA ⓘ | -10.46% | +4.74% |
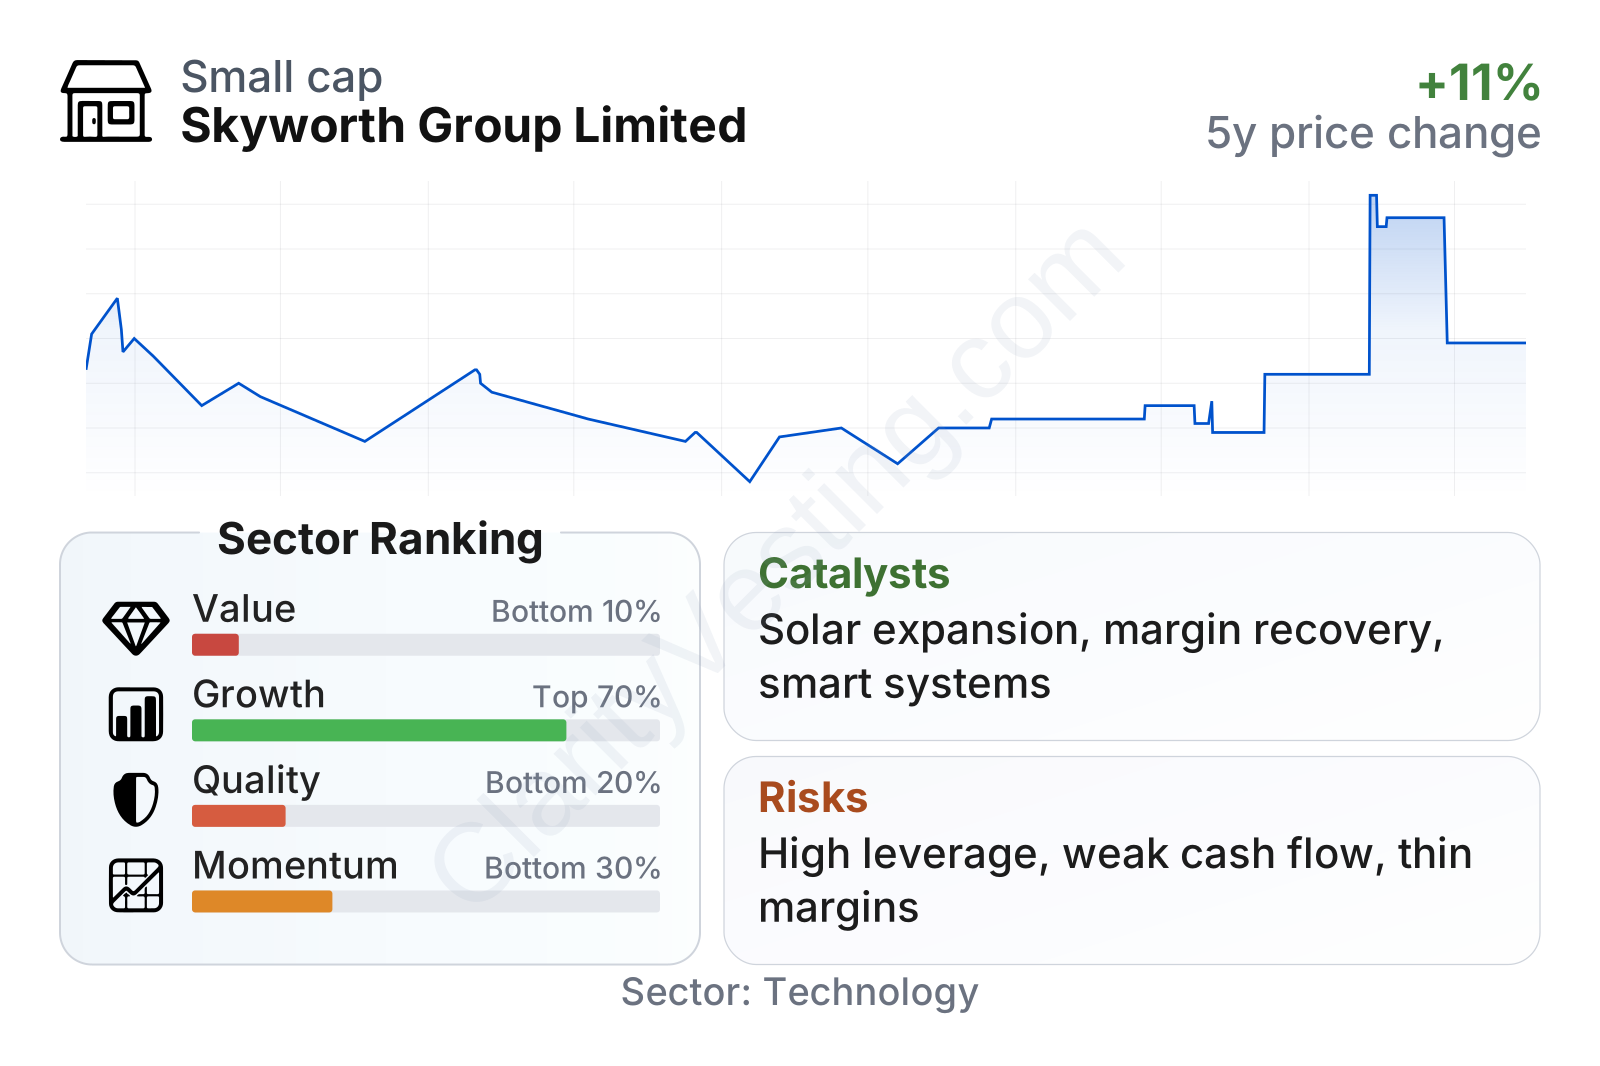
Skyworth sits in the smaller end of the public technology universe and its share price has been volatile. The stock rose strongly over the past year before giving back part of that move in the most recent months, which fits a company exposed to cyclical electronics demand and changing sentiment toward Chinese hardware names.
The metrics present a mixed profile. Valuation multiples look low compared with the broader sector, especially the earnings multiple, but that comes with weak cash generation and low profitability. Growth indicators are more favorable over a five-year view, with revenue per share and earnings per share expanding faster than many sector peers. Quality indicators are the main weak point: margins are thin, leverage is elevated, interest coverage is lower than the sector norm, and free cash flow has turned negative.
Growth
Skyworth operates in several markets that still offer long-term expansion potential, even if not all of them grow at the same speed. Traditional televisions are mature and very competitive, but higher-end displays, larger screen sizes, smart home connectivity, commercial display systems, and distributed solar installations remain active areas. The company’s strategy makes the most sense where it links hardware manufacturing with system integration and recurring ecosystem demand, rather than relying only on basic TV shipments.
The most important growth angle is the company’s move into new energy. For a hardware company with nationwide channels, installation capability, and household brand recognition, distributed solar can be a logical extension. It opens a market that is structurally different from televisions, with demand driven by electricity economics, policy support, and energy transition goals rather than only replacement cycles in consumer electronics.
There is also a second, quieter growth driver in smart systems. Broadband devices, connected home access products, and commercial display solutions are less visible than consumer TVs, but they can broaden customer relationships and reduce reliance on one-off retail purchases. This business can also benefit from telecom upgrades, enterprise digitalization, and screen-based commercial applications.
Recent operating trends support a cautious but real growth case. Five-year revenue-per-share growth of roughly 15% and five-year EPS growth of roughly 12% indicate that the business has been able to expand over a full cycle. Dividend growth has also been strong over that same period, suggesting management has historically returned part of that progress to shareholders. The challenge is that recent year-over-year growth is much slower than the sector median, which implies the company is not currently in an acceleration phase.
A meaningful catalyst would be any evidence that the new energy segment is scaling without dragging group cash flow, or that product mix in TVs and smart systems is shifting toward higher-margin categories such as premium displays, commercial products, and branded smart appliances. If those improvements appear together, Skyworth’s current low earnings multiple would look easier to justify as a reflection of temporary pressure rather than structural weakness.
Risks
This article is for informational purposes only and does not constitute financial advice. Some content is AI-generated. See Disclaimer


