Stock Analysis · Savills plc (SVLPF)
Overview
Savills plc is a global real estate services company. Rather than owning large portfolios of buildings like a traditional property landlord, it mainly earns money by advising clients and helping them transact, manage, value, finance, and market real estate. Its customers include corporations, property owners, investors, developers, funds, and public-sector bodies. The group operates across the United Kingdom, Asia-Pacific, Europe, the Middle East, Africa, and the Americas, giving it a broad geographic footprint and exposure to both commercial and residential property activity.
The business mix is diversified across advisory and recurring service lines. Based on the company’s annual reporting structure and recent revenue mix, the main sources of revenue are approximately:
- Transaction Advisory: about 40% to 45% of revenue. This includes leasing and investment sales advisory, where income depends heavily on property market activity and client deal volumes.
- Consultancy: about 20% to 25%. This covers valuation, project management, building consultancy, and other professional advice.
- Property and Facilities Management: about 20% to 25%. This includes managing buildings and related services for owners and occupiers, usually a steadier source of revenue than transactions.
- Residential: about 10% to 15%. This includes high-end residential sales, lettings, and related services in markets where Savills has a strong local brand.
This mix matters because Savills is not just tied to buying and selling property. The more recurring management and consultancy work helps soften the swings that come from weaker leasing or investment markets. Over the last few years, revenue has generally recovered after the post-rate-hike slowdown, but profitability has remained more volatile than sales, which is typical for service firms linked to cyclical property markets.
The profit flow shows a business with large revenue but relatively thin margins. Revenue has moved upward overall since 2021, while net income has been much more uneven, reflecting how sensitive earnings are to transaction activity, staff costs, and market sentiment.
Key Figures
| Metric | Value | Sector ⓘ |
|---|---|---|
| Date | Oct 17, 2026 | |
| Context | ||
| Sector | Real Estate | |
| Industry | Real Estate Services | |
| Market Cap ⓘ | $2.08B | |
| Beta ⓘ | 1.27 | |
Value (Cheapness) | ||
| P/E Ratio ⓘ | 20.18 | 17.38 |
| P/B Ratio ⓘ | 2.70 | 0.85 |
| FCF Yield ⓘ | 12.33% | 7.38% |
| Dividend Yield ⓘ | 1.88% | 4.85% |
| EBIT / EV ⓘ | N/A | 3.78% |
| PEG ⓘ | N/A | |
Growth (Business expansion) | ||
| Revenue Growth ⓘ | 8.70% | 5.30% |
| RPS Growth (5Y CAGR) ⓘ | 4.89% | 6.02% |
| EPS Growth (5Y CAGR) ⓘ | -30.47% | -11.37% |
| BVPS Growth (5Y CAGR) ⓘ | 0.61% | 0.45% |
| Margin Growth (5Y Trend) ⓘ | -4.63% | -0.22% |
| FCF Growth (5Y CAGR) ⓘ | -13.93% | 5.40% |
| DPS Growth (5Y CAGR) ⓘ | 8.04% | 5.02% |
Quality (Business durability) | ||
| ROIC (Latest) ⓘ | 12.21% | 5.69% |
| ROE (Latest) ⓘ | 17.39% | 7.56% |
| ROA (Latest) ⓘ | 5.32% | 2.85% |
| ROIC (5Y Median) ⓘ | 9.90% | 4.22% |
| ROE (5Y Median) ⓘ | 9.82% | 6.03% |
| ROA (5Y Median) ⓘ | 3.08% | 2.44% |
| Net Debt / EBIT (Latest) ⓘ | 1.37 | 7.59 |
| Net Debt / EBIT (5Y Median) ⓘ | 0.25 | 8.40 |
| Net Debt / EBITDA (Latest) ⓘ | 0.77 | 5.27 |
| Net Debt / Assets ⓘ | 13.06% | 37.76% |
| EBITDA / Interest ⓘ | 4.63 | 4.10 |
| Operating Margin (Latest) ⓘ | 4.27% | 35.29% |
| Operating Margin (5Y Median) ⓘ | 5.46% | 37.31% |
| Debt to Equity (Latest) ⓘ | 113.66% | 88.87% |
| Profit Margin (Latest) ⓘ | 2.50% | 19.61% |
| Free Cash Flow (Latest) ⓘ | $256.33M | |
Momentum (Price trend) | ||
| 3Y Return ⓘ | +27.94% | +30.75% |
| 12M Return (excl. last month) ⓘ | +18.28% | +4.36% |
| 6M Return ⓘ | -3.10% | -2.52% |
| Price vs. 200-Day MA ⓘ | -1.23% | -2.34% |
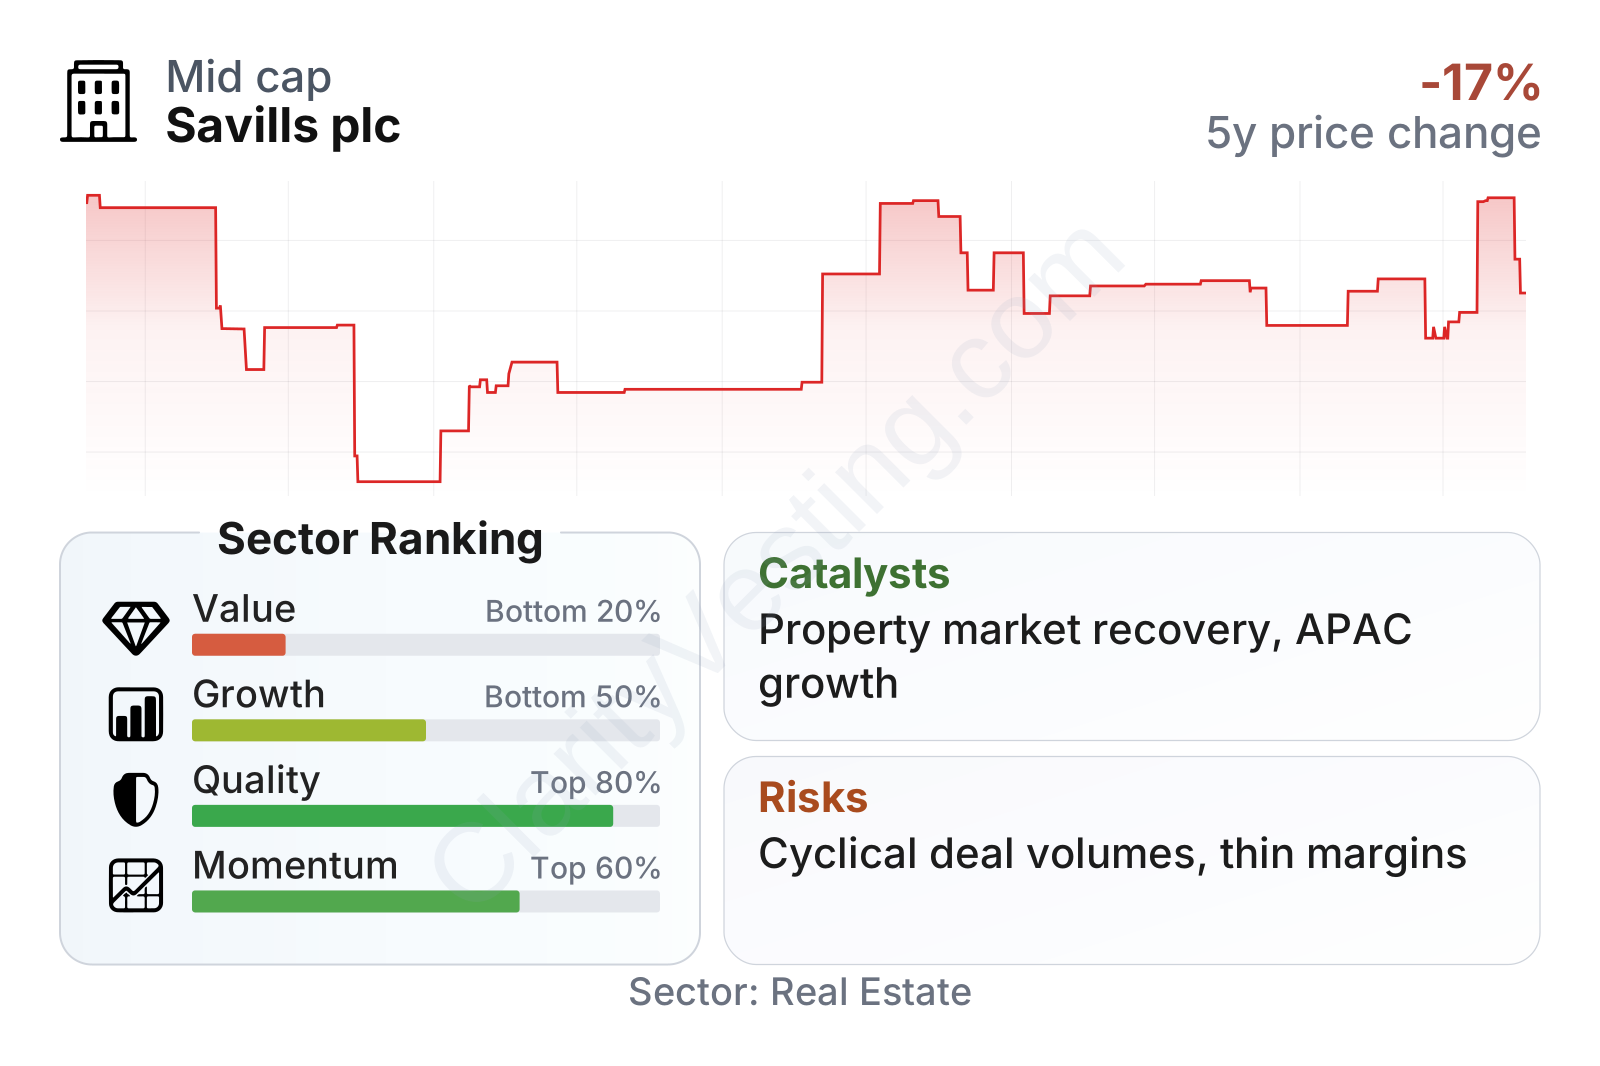
Savills sits in an unusual position: quality and share-price momentum look stronger than much of the real estate sector, while value and medium-term growth metrics are weaker. Returns on capital and equity are clearly above sector medians, and leverage is moderate by sector standards. On the other hand, margins are slim, earnings growth over five years has been weak, and the stock trades at richer valuation multiples than many peers. The stock has also rebounded strongly from its 2022 low, which helps explain why valuation now looks fuller.
In size terms, Savills is a mid-sized listed real estate services group rather than a giant global platform. Its beta above 1 suggests the shares can move more sharply than the broader market, which fits the cyclical nature of the property advisory business.
Growth
Savills operates in a sector with long-term structural relevance. Real estate remains a massive global asset class, and large occupiers and owners increasingly outsource specialist work such as valuations, project management, workplace strategy, and property operations. That creates room for firms with international scale, cross-border networks, and strong institutional relationships. In that sense, the company is in a business with durable demand, even if yearly results can swing with the property cycle.
The strategy also makes sense for future growth. Savills has continued to build out less cyclical service lines such as property management, facilities management, and consultancy while keeping its exposure to higher-margin transaction businesses. That balance is important: recurring activities can support revenue in weak markets, while transactional businesses can lift profits quickly when investment and leasing volumes recover.
Revenue per share has shown a generally upward trend over the last five years, pointing to a business that has expanded even through a difficult property environment. The pace has not been exceptional, but it shows resilience and supports the view that the platform has held or improved its market position.
The dividend per share has been uneven from year to year, which reflects the cyclicality of profits, but the broader trend over five years is still positive. That suggests management has aimed to keep shareholder distributions aligned with recovery in earnings rather than forcing a rigid payout through a downturn.
A major catalyst for Savills is a normalization in global property transaction markets after the shock from higher interest rates. When financing conditions stabilize, clients tend to restart leasing decisions, investment sales, refinancing, portfolio reshaping, and development planning. Because Savills has meaningful exposure to those activities, even modest market improvement can have an outsized effect on profit compared with revenue.
Another potential growth driver is continued expansion in Asia-Pacific and in outsourced real estate services for large corporate and institutional clients. These areas can benefit from urbanization, multinational occupier demand, and rising complexity in managing portfolios across countries. Recent company communications have also highlighted stronger activity in some transaction markets and the benefit of a broad international platform, indicating that the business is positioned to capture recovery where it appears first rather than relying on one country alone.
Risks
This article is for informational purposes only and does not constitute financial advice. Some content is AI-generated. See Disclaimer


