Stock Analysis · SunocoCorp LLC (SUNC)
Overview
SunocoCorp LLC operates in the energy midstream segment. In simple terms, it helps move, store, and market refined petroleum products and related fuels rather than focusing mainly on drilling for oil or gas. Midstream businesses typically earn money from logistics, fuel distribution, terminal operations, and supply agreements, which can make results steadier than those of pure commodity producers, although margins are often thin.
Based on the company’s recent business profile and reporting structure, revenue is primarily tied to fuel sales and fuel-related distribution activity. For a company in this part of the industry, reported revenue can look very large because it includes the pass-through cost of the fuel itself, while actual profit depends on small spreads, fees, and operating efficiency.
The main revenue sources appear to be:
- Fuel distribution and marketing: approximately 80% to 90% of revenue. This usually includes wholesale motor fuel sales, supply agreements, and related product marketing.
- Terminal and storage services: approximately 5% to 15% of revenue. This generally covers fees from storing and handling refined products.
- Other midstream and support activities: approximately 0% to 10% of revenue. This can include logistics, ancillary fees, and other commercial arrangements tied to product movement.
One important point for long-term readers is that SunocoCorp’s economics are not best understood through revenue alone. The business converts a very large sales base into a much smaller operating profit, which is common in fuel distribution. Over the last three reported full years, revenue moved from about $23.1 billion in 2023 to $22.7 billion in 2024 and then to about $25.2 billion in 2025, while gross profit and operating income improved meaningfully before higher interest costs and other pressures weighed on bottom-line results.
The flow of revenue through the income statement shows a business with very high product costs, improving gross profit over time, and rising interest expense that has become a much larger drag on earnings. That pattern matters because it suggests the company’s operating platform expanded, but the balance sheet and financing burden now play a major role in how much profit reaches shareholders.
Key Figures
| Metric | Value | Sector ⓘ |
|---|---|---|
| Date | Oct 03, 2026 | |
| Context | ||
| Sector | Energy | |
| Industry | Oil & Gas Midstream | |
| Market Cap ⓘ | $3.76B | |
| Beta ⓘ | N/A | |
Value (Cheapness) | ||
| P/E Ratio ⓘ | 12.20 | 14.47 |
| P/B Ratio ⓘ | 1.55 | 1.70 |
| FCF Yield ⓘ | 35.09% | 8.66% |
| Dividend Yield ⓘ | 7.50% | 3.77% |
| EBIT / EV ⓘ | 11.08% | 7.46% |
| PEG ⓘ | N/A | |
Growth (Business expansion) | ||
| Revenue Growth ⓘ | 164.50% | 27.35% |
| RPS Growth (5Y CAGR) ⓘ | 25.19% | 6.75% |
| EPS Growth (5Y CAGR) ⓘ | N/A | -15.45% |
| BVPS Growth (5Y CAGR) ⓘ | 22.09% | 5.85% |
| Margin Growth (5Y Trend) ⓘ | 1.67% | 0.75% |
| FCF Growth (5Y CAGR) ⓘ | 23.87% | 3.62% |
| DPS Growth (5Y CAGR) ⓘ | 21.69% | 16.85% |
Quality (Business durability) | ||
| ROIC (Latest) ⓘ | N/A | 11.33% |
| ROA (Latest) ⓘ | N/A | 6.03% |
| ROIC (5Y Median) ⓘ | N/A | 10.16% |
| ROA (5Y Median) ⓘ | 17.33% | 5.34% |
| Net Debt / EBIT (Latest) ⓘ | 7.07 | 1.62 |
| Net Debt / EBIT (5Y Median) ⓘ | N/A | 1.91 |
| Net Debt / EBITDA (Latest) ⓘ | 4.80 | 1.06 |
| Net Debt / Assets ⓘ | 47.01% | 17.29% |
| EBITDA / Interest ⓘ | 4.22 | 9.64 |
| Operating Margin (Latest) ⓘ | 4.49% | 16.32% |
| Operating Margin (5Y Median) ⓘ | 4.48% | 19.53% |
| Debt to Equity (Latest) ⓘ | 582.69% | 54.41% |
| Profit Margin (Latest) ⓘ | 0.80% | 8.79% |
| Free Cash Flow (Latest) ⓘ | $1.32B | |
Momentum (Price trend) | ||
| 3Y Return ⓘ | N/A | +62.93% |
| 12M Return (excl. last month) ⓘ | N/A | +44.83% |
| 6M Return ⓘ | +22.10% | -1.62% |
| Price vs. 200-Day MA ⓘ | +14.69% | +5.18% |
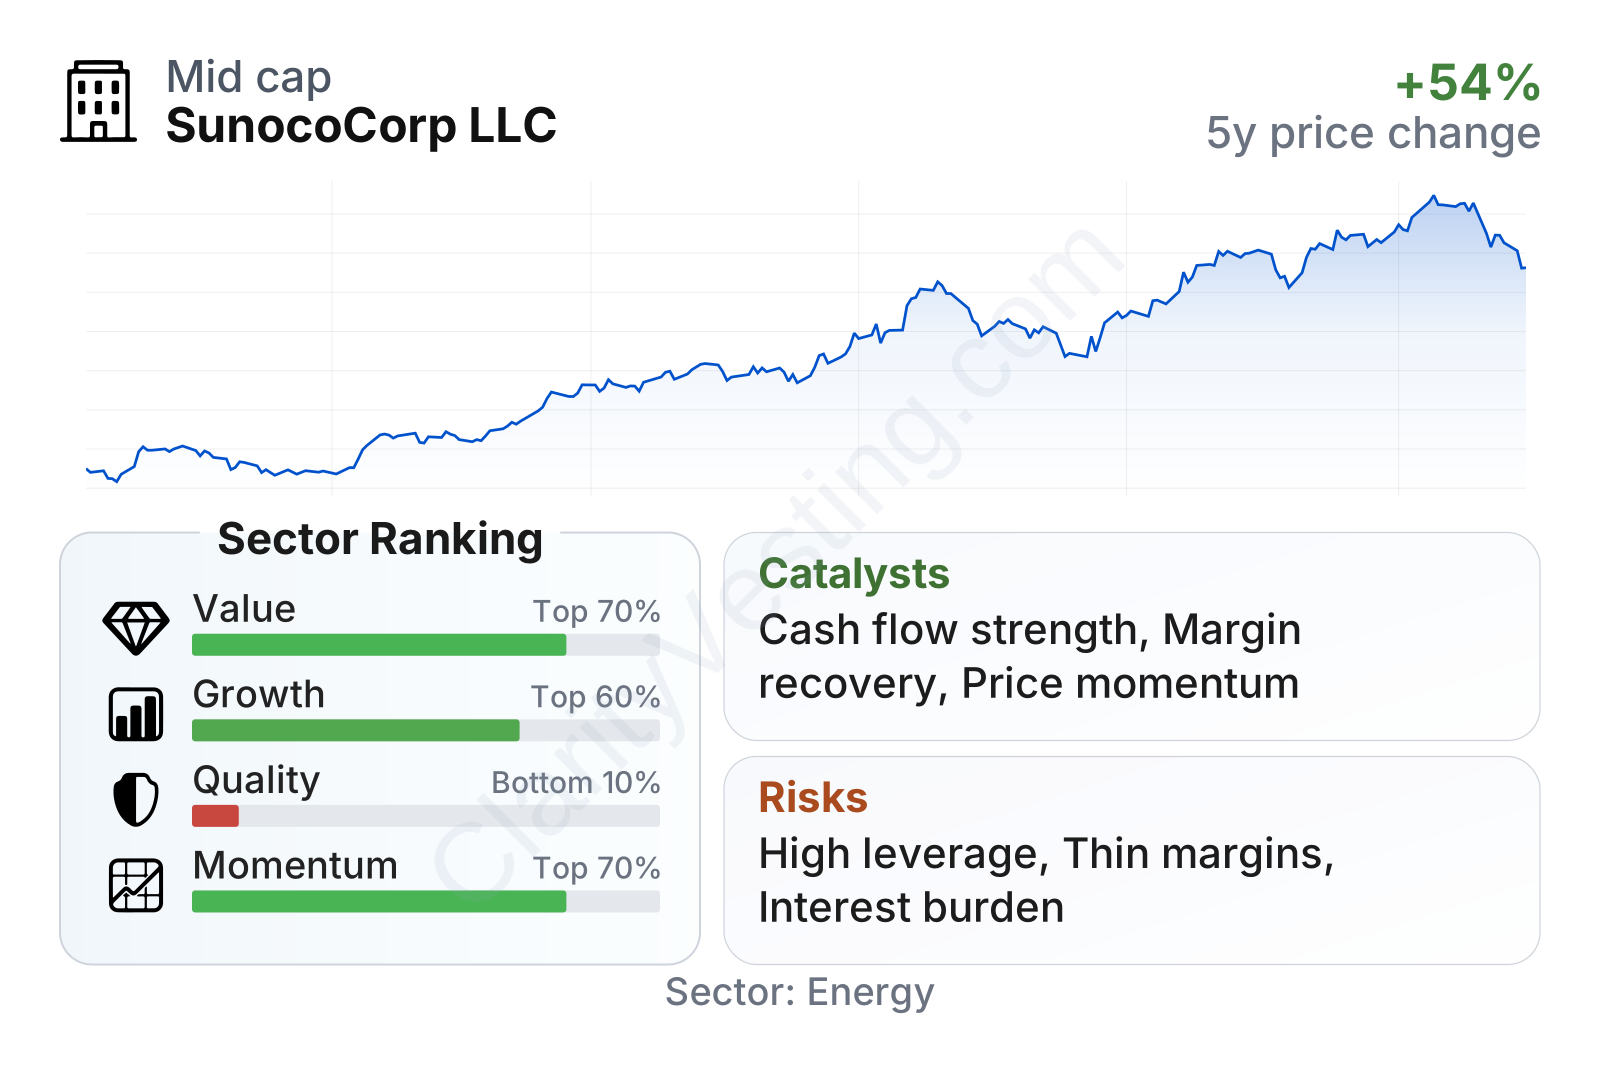
The recent market picture is mixed but understandable. On valuation, the shares screen below the sector median on earnings and roughly in line on book value, while free cash flow yield and dividend yield stand out as unusually strong versus many energy peers. Growth metrics are also robust, with revenue, cash flow, and book value expanding faster than sector medians over multi-year periods. The weak point is quality: leverage is far above normal for the sector, interest coverage is noticeably lower than peers, and profit margins remain thin. Price momentum has been favorable in recent months, suggesting the market has been recognizing the stronger operating performance despite those balance-sheet concerns.
Growth
SunocoCorp operates in a mature but still necessary part of the energy value chain. Fuel logistics and refined-product distribution are not high-growth markets in the way software or semiconductors can be, but they remain essential to transportation, commercial activity, and regional fuel supply. That makes the sector more about scale, network efficiency, asset utilization, and disciplined acquisitions than about breakthrough innovation.
Within that context, the company’s strategy appears logical. Its financial profile points to a business that has been expanding its revenue base and cash generation faster than much of its sector. Revenue per share growth of roughly 25% annualized over five years and free cash flow growth near 24% annualized suggest more than just short-term fuel-price volatility. Those trends usually indicate a larger operating footprint, improved commercial positioning, or both.
A notable positive is the improvement in gross profit and operating income from 2023 through 2025. Even though reported net income became weak in 2025, the operating side of the business still showed meaningful earnings power. That can matter because long-term value in midstream often comes from stable asset cash generation, contract relationships, and the ability to keep volumes flowing through terminals and distribution networks.
The sector backdrop is supportive in a practical sense. North American fuel demand may not be a major structural growth engine, but the need for storage, blending, transportation, and last-mile distribution remains durable. If the company continues to build density in its network, it may be able to capture efficiencies and defend margins better than smaller operators.
Another visible catalyst is the market’s recent reassessment of the stock. The share price moved sharply higher from late 2025 into mid-2026, and it has outperformed the sector median over the past six months. That does not prove fundamentals will keep improving, but it often reflects growing confidence that the company’s cash generation and operating assets deserve more credit than earlier market pricing implied.
Risks
This article is for informational purposes only and does not constitute financial advice. Some content is AI-generated. See Disclaimer


