Stock Analysis · Sunbelt Rentals Holdings Inc (SUNB)
Overview
Sunbelt Rentals Holdings Inc is one of the largest equipment rental businesses in North America. It provides machinery, tools, and related services that customers use for construction, industrial work, maintenance, infrastructure projects, events, disaster response, and other temporary needs. Instead of owning expensive equipment, customers can rent what they need for a specific job or period. That makes the business closely tied to activity in construction and industrial markets, but also supported by repair, maintenance, emergency work, and specialty applications.
The company operates through the Sunbelt Rentals brand and is part of Ashtead’s North American rental platform. Its model is built on a large fleet, a wide branch network, specialty rental offerings, and the ability to serve both local customers and very large national accounts. That scale matters because equipment availability, delivery speed, maintenance quality, and branch density are major factors in this industry.
Based on company reporting, revenue is primarily generated from equipment rentals and closely related services. The broad mix can be summarized as follows:
- Equipment rentals and related revenue: approximately 90%+ of total revenue. This includes general construction equipment and specialty categories such as power, climate control, pumps, trench safety, flooring solutions, scaffolding, remediation, and other niche rental services.
- Sales of used rental equipment and merchandise: approximately 5% to 10%. Rental companies regularly sell older fleet assets and certain consumables or supplies.
- Other revenue: a small remainder from delivery, service, and related customer support activities where separately recognized.
Within that rental base, the business is also diversified by end market. Non-residential construction is a major driver, but the company also serves industrial customers, municipal and infrastructure projects, and a growing range of specialty and event-related needs. That mix helps reduce reliance on any single project type, although construction remains the main engine.
The operating profile has been strong over the past several years: revenue rose from about $8.0 billion in fiscal 2022 to more than $11.1 billion in fiscal 2026. Over that period, operating income and net income remained substantial, even though margins eased from peak levels as expansion, fleet costs, and market normalization weighed on profitability.
The multi-year picture shows a business that expanded meaningfully in size before seeing some margin compression. Revenue has continued to climb, but profits have not increased at the same pace, which suggests that growth has recently required a higher cost base and a more normal pricing environment than in the strongest post-pandemic years.
Key Figures
| Metric | Value | Sector ⓘ |
|---|---|---|
| Date | Oct 24, 2026 | |
| Context | ||
| Sector | Industrials | |
| Industry | Rental & Leasing Services | |
| Market Cap ⓘ | $31.55B | |
| Beta ⓘ | 1.67 | |
Value (Cheapness) | ||
| P/E Ratio ⓘ | 23.26 | 22.29 |
| P/B Ratio ⓘ | 4.41 | 1.98 |
| FCF Yield ⓘ | 11.70% | 6.26% |
| Dividend Yield ⓘ | 1.88% | 1.92% |
| EBIT / EV ⓘ | 5.44% | 4.83% |
| PEG ⓘ | 1.14 | |
Growth (Business expansion) | ||
| Revenue Growth ⓘ | 11.20% | 9.30% |
| RPS Growth (5Y CAGR) ⓘ | 10.77% | 7.76% |
| EPS Growth (5Y CAGR) ⓘ | N/A | -13.17% |
| BVPS Growth (5Y CAGR) ⓘ | 12.15% | 6.13% |
| Margin Growth (5Y Trend) ⓘ | -4.17% | 0.74% |
| FCF Growth (5Y CAGR) ⓘ | 32.89% | 10.79% |
| DPS Growth (5Y CAGR) ⓘ | 16.65% | 9.41% |
Quality (Business durability) | ||
| ROIC (Latest) ⓘ | 11.06% | 10.75% |
| ROA (Latest) ⓘ | 6.04% | 5.41% |
| ROIC (5Y Median) ⓘ | N/A | 9.37% |
| ROA (5Y Median) ⓘ | 7.44% | 4.95% |
| Net Debt / EBIT (Latest) ⓘ | 5.49 | 2.04 |
| Net Debt / EBIT (5Y Median) ⓘ | 4.03 | 2.27 |
| Net Debt / EBITDA (Latest) ⓘ | 3.10 | 1.39 |
| Net Debt / Assets ⓘ | 53.56% | 19.27% |
| EBITDA / Interest ⓘ | 9.45 | 9.58 |
| Operating Margin (Latest) ⓘ | 20.10% | 10.49% |
| Operating Margin (5Y Median) ⓘ | 23.79% | 10.30% |
| Debt to Equity (Latest) ⓘ | 170.24% | 64.82% |
| Profit Margin (Latest) ⓘ | 12.12% | 6.67% |
| Free Cash Flow (Latest) ⓘ | $3.69B | |
Momentum (Price trend) | ||
| 3Y Return ⓘ | N/A | +67.77% |
| 12M Return (excl. last month) ⓘ | N/A | +12.05% |
| 6M Return ⓘ | +12.85% | 0.00% |
| Price vs. 200-Day MA ⓘ | N/A | +0.67% |
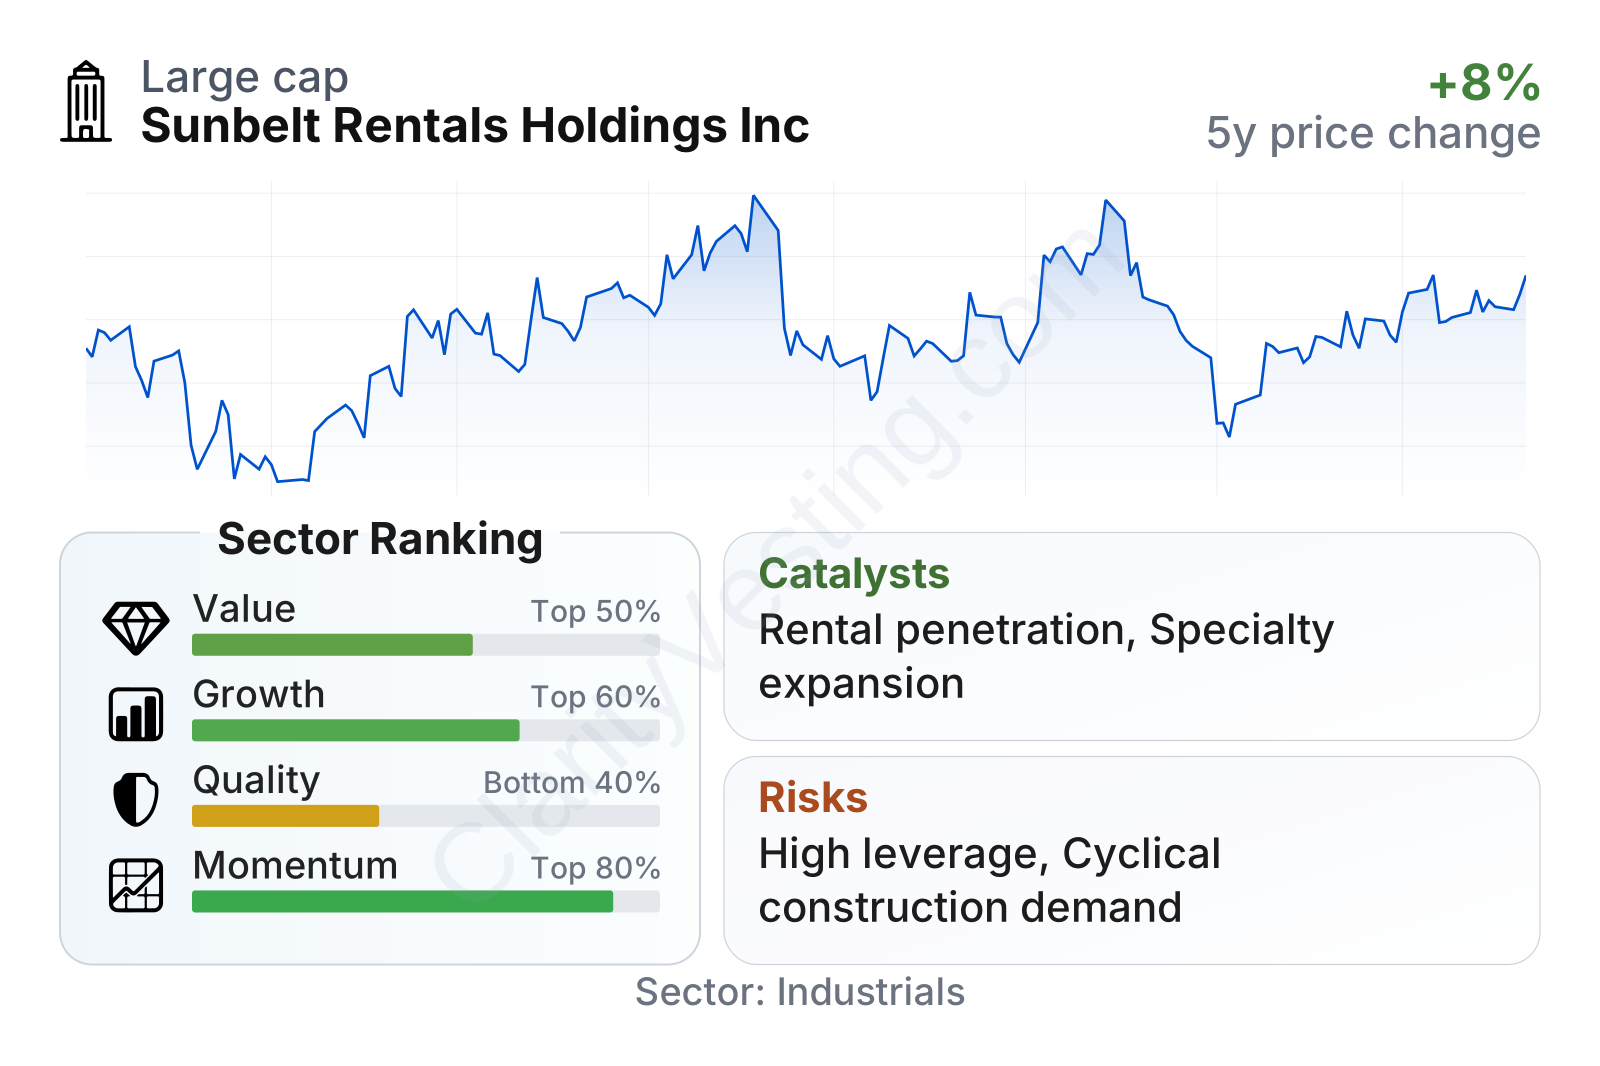
Sunbelt stands out as a large company in rental and leasing services, with market value in the large-cap range. On valuation, its earnings multiple sits close to the sector median, while its price-to-book ratio is notably higher, which usually reflects the market assigning a premium to fleet quality, scale, and earnings power. Free cash flow generation looks particularly strong relative to the sector, and dividend yield is roughly in line with peers.
Growth metrics are broadly favorable. Recent revenue growth has been above the sector median, and the five-year record for revenue per share, book value per share, free cash flow, and dividends points to meaningful expansion. The weak spot is margin direction: operating margin remains high versus the sector, but it has trended down from its own earlier levels.
Quality is more mixed than the headline profitability suggests. Returns on assets and invested capital are solid, and operating margin is well above sector norms. However, leverage is clearly elevated, which pulls down the overall quality profile. Interest coverage remains adequate, but debt is materially higher than many peers, so balance-sheet discipline remains an important point to watch.
Share performance has been somewhat uneven in recent months rather than strongly directional. Even so, medium-term momentum indicators remain better than a large part of the sector, suggesting the market still recognizes the company’s scale and cash-generation profile despite concerns around leverage and margins.
Growth
The company operates in a sector that has favorable long-term characteristics. Equipment rental has gradually taken share from equipment ownership because renting lowers upfront costs, improves flexibility, and shifts maintenance and fleet management to specialist providers. That trend is especially relevant for contractors and industrial operators facing tighter capital budgets, project variability, and the need for specialized equipment only used occasionally.
Sunbelt’s strategy fits well with that backdrop. The company has emphasized branch expansion, specialty rental categories, larger customer relationships, and selective acquisitions. Specialty rental is especially important because it can carry stronger pricing, deeper technical expertise, and more recurring demand than standard equipment categories. It also broadens the company’s exposure beyond traditional building construction.
Another support for growth is the continued need for infrastructure investment, manufacturing-related construction, data center development, utility work, and disaster recovery. These activities often require rented power equipment, climate control systems, pumps, trench safety gear, and general access equipment. A broad fleet and national footprint make Sunbelt well positioned to capture this type of project demand.
Recent financial performance also supports the case that the company is still expanding, even if growth is no longer as exceptional as in the immediate post-pandemic period. Revenue increased again in fiscal 2026, reaching about $11.2 billion, which indicates that demand has remained resilient enough to offset a more normal operating backdrop. The company’s strong free cash flow also gives it flexibility to refresh fleet, add locations, and pursue targeted expansion without relying entirely on new borrowing.
A practical catalyst is ongoing rental penetration in North America. Many end users still own equipment fleets that can be partially outsourced over time. For a scaled operator, each additional branch and each specialty vertical can strengthen local density, improve asset utilization, and increase cross-selling opportunities across a large customer base.
Risks
This article is for informational purposes only and does not constitute financial advice. Some content is AI-generated. See Disclaimer