Stock Analysis · Sunoco LP (SUN)
Overview
Sunoco LP is a large U.S. fuel distributor and marketing company. It supplies motor fuels to convenience stores, independent dealers, commercial customers, and other wholesale buyers, while also operating a smaller but meaningful pipeline and terminal business. In simple terms, Sunoco sits mainly in the middle of the fuel value chain: it buys fuel, moves it through its logistics network, and sells it to customers that then resell or use it.
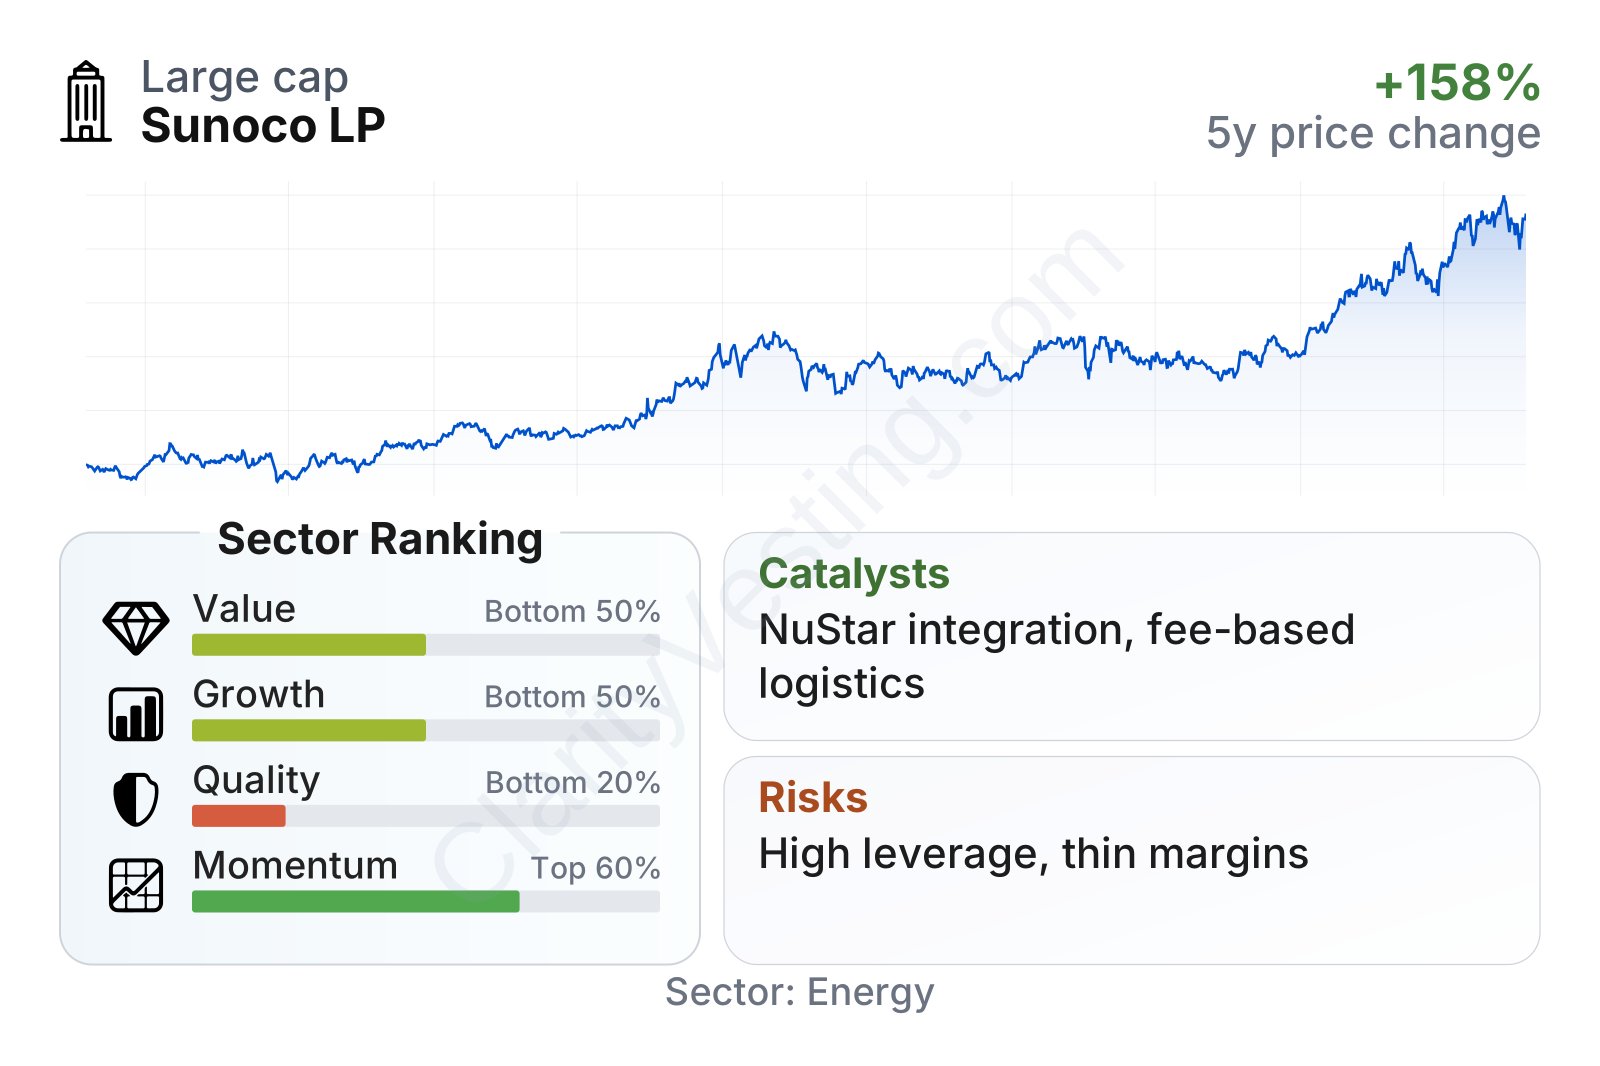
The business became much larger and more diversified after recent acquisitions, especially NuStar Energy, which added pipelines, terminals, and storage assets. That matters because it gives Sunoco more fee-based infrastructure earnings alongside its traditional fuel distribution activities, which are usually lower margin and more exposed to fuel price swings.
Based on the latest company disclosures, Sunoco’s revenue is still dominated by fuel sales, while a smaller share comes from transportation, terminalling, and storage-related services. A practical breakdown is:
- Fuel distribution and marketing: approximately 90% to 95% of revenue. This includes wholesale motor fuel sold to convenience stores, dealers, distributors, commercial fleets, and other customers.
- Pipeline, terminal, and storage services: approximately 5% to 10% of revenue. This includes refined-product and crude logistics, terminaling, and related fees. The revenue share is smaller than fuel sales, but the profit contribution can be more meaningful because these activities are often fee-based.
One important point for long-term readers is that revenue alone does not tell the full story here. In fuel distribution, sales can be very large because fuel itself is expensive, but margins are thin. By contrast, infrastructure services can generate a smaller portion of revenue while producing steadier earnings and cash flow.
The recent financial flow also shows this pattern clearly: revenue has moved around with fuel prices and acquisitions, while gross profit and operating income have improved more steadily than headline sales. Gross profit rose from a little above $1.1 billion in 2021-2023 to more than $2.1 billion in 2025, suggesting the company is becoming larger and more operationally diversified.
Key Figures
| Metric | Value | Sector ⓘ |
|---|---|---|
| Date | Oct 17, 2026 | |
| Context | ||
| Sector | Energy | |
| Industry | Oil & Gas Refining & Marketing | |
| Market Cap ⓘ | $14.43B | |
| Beta ⓘ | 0.42 | |
Value (Cheapness) | ||
| P/E Ratio ⓘ | 16.91 | 15.44 |
| P/B Ratio ⓘ | 1.26 | 1.73 |
| FCF Yield ⓘ | 11.50% | 8.20% |
| Dividend Yield ⓘ | 5.09% | 3.59% |
| EBIT / EV ⓘ | 7.21% | 7.46% |
| PEG ⓘ | 8.54 | |
Growth (Business expansion) | ||
| Revenue Growth ⓘ | 164.50% | 26.90% |
| RPS Growth (5Y CAGR) ⓘ | -3.11% | 6.90% |
| EPS Growth (5Y CAGR) ⓘ | -15.24% | -15.73% |
| BVPS Growth (5Y CAGR) ⓘ | 57.01% | 6.07% |
| Margin Growth (5Y Trend) ⓘ | 0.45% | 0.58% |
| FCF Growth (5Y CAGR) ⓘ | 13.62% | 1.86% |
| DPS Growth (5Y CAGR) ⓘ | 3.16% | 16.79% |
Quality (Business durability) | ||
| ROIC (Latest) ⓘ | 8.69% | 11.40% |
| ROA (Latest) ⓘ | 4.66% | 6.06% |
| ROIC (5Y Median) ⓘ | 12.97% | 10.30% |
| ROA (5Y Median) ⓘ | 6.27% | 5.42% |
| Net Debt / EBIT (Latest) ⓘ | 6.92 | 1.64 |
| Net Debt / EBIT (5Y Median) ⓘ | 6.36 | 1.83 |
| Net Debt / EBITDA (Latest) ⓘ | 4.72 | 1.08 |
| Net Debt / Assets ⓘ | 47.01% | 17.29% |
| EBITDA / Interest ⓘ | 4.25 | 9.64 |
| Operating Margin (Latest) ⓘ | 5.14% | 16.27% |
| Operating Margin (5Y Median) ⓘ | 2.90% | 20.39% |
| Debt to Equity (Latest) ⓘ | 177.78% | 54.76% |
| Profit Margin (Latest) ⓘ | 2.93% | 8.82% |
| Free Cash Flow (Latest) ⓘ | $1.66B | |
Momentum (Price trend) | ||
| 3Y Return ⓘ | +83.32% | +67.38% |
| 12M Return (excl. last month) ⓘ | +64.90% | +49.19% |
| 6M Return ⓘ | +20.01% | +7.07% |
| Price vs. 200-Day MA ⓘ | +15.84% | +9.56% |
Sunoco is a large energy company by market value, but its trading profile is less volatile than many energy names, with a beta well below 1. On valuation, the picture is mixed: earnings and enterprise-value measures sit around the sector range rather than at a clear discount, while free cash flow yield and dividend yield are stronger than the sector median. On growth and quality, the profile is more uneven. Recent top-line expansion is very strong, but longer-term per-share growth and returns on capital remain less impressive, and leverage metrics are still a major constraint.
The stock’s multi-year performance has been strong, with the share price climbing substantially since 2021 and momentum remaining above the sector median over several measured periods. That strength suggests the market has been rewarding the company’s expanding asset base and cash generation despite balance-sheet concerns.
Growth
Sunoco operates in a mature sector rather than a classic high-growth industry. U.S. gasoline demand is not a structural growth market in the way software or semiconductor markets can be. However, that does not mean the company cannot grow. In Sunoco’s case, growth is more likely to come from scale, acquisitions, network optimization, and expanding logistics earnings rather than from a rapid rise in fuel consumption.
The current strategy is logical for that kind of industry. Management has been building a broader platform that mixes high-volume fuel distribution with infrastructure assets that can add more recurring, fee-based cash flow. The NuStar acquisition is the clearest example. It broadens Sunoco beyond pure fuel distribution and increases its exposure to pipelines, terminals, and storage, which are generally more stable businesses.
Recent revenue growth looks unusually strong, well above the sector median, but that number should be interpreted carefully. A large part of the surge likely reflects acquisition effects and changes in fuel prices rather than purely organic expansion. For this business, it is more useful to focus on whether gross profit, operating income, and cash flow are expanding in a durable way. On that front, the trend has improved meaningfully over the last two years.
Free cash flow has been volatile, which is normal for a business affected by working capital swings, acquisitions, and debt costs. Even so, trailing free cash flow has recovered to a much healthier level after a weak point in 2025. That matters because Sunoco’s model depends heavily on turning earnings into cash that can support distributions, debt service, and future transactions.
A key catalyst for future growth is integration. If Sunoco successfully folds acquired assets into a more efficient network, it can improve margins and cash flow even without strong demand growth in the underlying fuel market. Another opportunity comes from its larger logistics footprint, which can help reduce dependence on purely volume-driven fuel sales. In short, this is not a business likely to grow because the end market suddenly accelerates; it is a business that can grow by becoming a larger, more integrated energy distribution and logistics platform.
Risks
This article is for informational purposes only and does not constitute financial advice. Some content is AI-generated. See Disclaimer


