Stock Analysis · Sun Communities Inc (SUI)
Overview
Sun Communities Inc. is a residential real estate investment trust, or REIT. In simple terms, it owns and operates communities where people live, stay seasonally, or vacation. Its portfolio is centered on manufactured housing communities, recreational vehicle communities, marinas, and a smaller U.K. holiday parks business. The company earns recurring income by renting sites, slips, and related amenities rather than by building and selling homes.
That business mix matters for long-term analysis because much of Sun’s revenue comes from property types that can be relatively resilient. Manufactured housing residents often face high moving costs, marina customers value location and convenience, and RV and holiday park assets add a leisure component that can expand when travel demand is healthy.
Based on the company’s recent annual disclosures, revenue is mainly generated from the following activities:
- Manufactured housing and annual RV communities: approximately 45% to 50% of total revenue. This includes annual site rent, utility reimbursements, and other property-related income from residents and long-term RV users.
- Marinas: approximately 25% to 30%. This includes slip rentals, storage, service, fuel, and other marina-related income.
- Transient RV and U.K. holiday parks: approximately 20% to 25%. This includes short-term stays, seasonal accommodation, and related vacation-oriented revenue.
- Home sales and other activities: approximately 5% to 10%. This includes manufactured home sales, brokerage-related activity, and miscellaneous property income.
Over the last several years, Sun expanded through acquisitions and portfolio development, which increased scale but also added complexity. Revenue climbed strongly from 2021 through 2024, although the business mix and reported earnings were affected by asset sales, integration work, and higher financing costs. That makes Sun easier to understand as an asset owner with recurring cash generation than as a pure earnings-growth company.
The broad trend shows revenue grew meaningfully from 2021 to 2024, but profitability became more uneven as operating costs and interest expense increased. Reported net income has been much more volatile than top-line revenue, which is important for reading the company beyond headline earnings.
Key Figures
| Metric | Value | Sector ⓘ |
|---|---|---|
| Date | Oct 17, 2026 | |
| Context | ||
| Sector | Real Estate | |
| Industry | REIT - Residential | |
| Market Cap ⓘ | $14.43B | |
| Beta ⓘ | 0.76 | |
Value (Cheapness) | ||
| P/E Ratio ⓘ | 85.25 | 17.38 |
| P/B Ratio ⓘ | 2.71 | 0.85 |
| FCF Yield ⓘ | 5.75% | 7.38% |
| Dividend Yield ⓘ | 3.82% | 4.85% |
| EBIT / EV ⓘ | 2.20% | 3.78% |
| PEG ⓘ | 8.16 | |
Growth (Business expansion) | ||
| Revenue Growth ⓘ | 0.20% | 5.30% |
| RPS Growth (5Y CAGR) ⓘ | -2.07% | 6.02% |
| EPS Growth (5Y CAGR) ⓘ | -8.98% | -11.37% |
| BVPS Growth (5Y CAGR) ⓘ | -1.36% | 0.45% |
| Margin Growth (5Y Trend) ⓘ | -17.94% | -0.22% |
| FCF Growth (5Y CAGR) ⓘ | 3.48% | 5.40% |
| DPS Growth (5Y CAGR) ⓘ | 24.58% | 5.02% |
Quality (Business durability) | ||
| ROIC (Latest) ⓘ | 1.53% | 5.69% |
| ROE (Latest) ⓘ | -14.08% | 7.56% |
| ROA (Latest) ⓘ | -7.29% | 2.85% |
| ROIC (5Y Median) ⓘ | 3.63% | 4.22% |
| ROE (5Y Median) ⓘ | 3.37% | 6.03% |
| ROA (5Y Median) ⓘ | 1.58% | 2.44% |
| Net Debt / EBIT (Latest) ⓘ | 9.96 | 7.59 |
| Net Debt / EBIT (5Y Median) ⓘ | 14.00 | 8.40 |
| Net Debt / EBITDA (Latest) ⓘ | 3.06 | 5.27 |
| Net Debt / Assets ⓘ | 35.77% | 37.76% |
| EBITDA / Interest ⓘ | 8.23 | 4.10 |
| Operating Margin (Latest) ⓘ | 17.76% | 35.29% |
| Operating Margin (5Y Median) ⓘ | 13.19% | 37.31% |
| Debt to Equity (Latest) ⓘ | 73.42% | 88.87% |
| Profit Margin (Latest) ⓘ | -37.36% | 19.61% |
| Free Cash Flow (Latest) ⓘ | $830.40M | |
Momentum (Price trend) | ||
| 3Y Return ⓘ | +26.37% | +30.75% |
| 12M Return (excl. last month) ⓘ | -5.76% | +4.36% |
| 6M Return ⓘ | -8.15% | -2.52% |
| Price vs. 200-Day MA ⓘ | -4.69% | -2.34% |
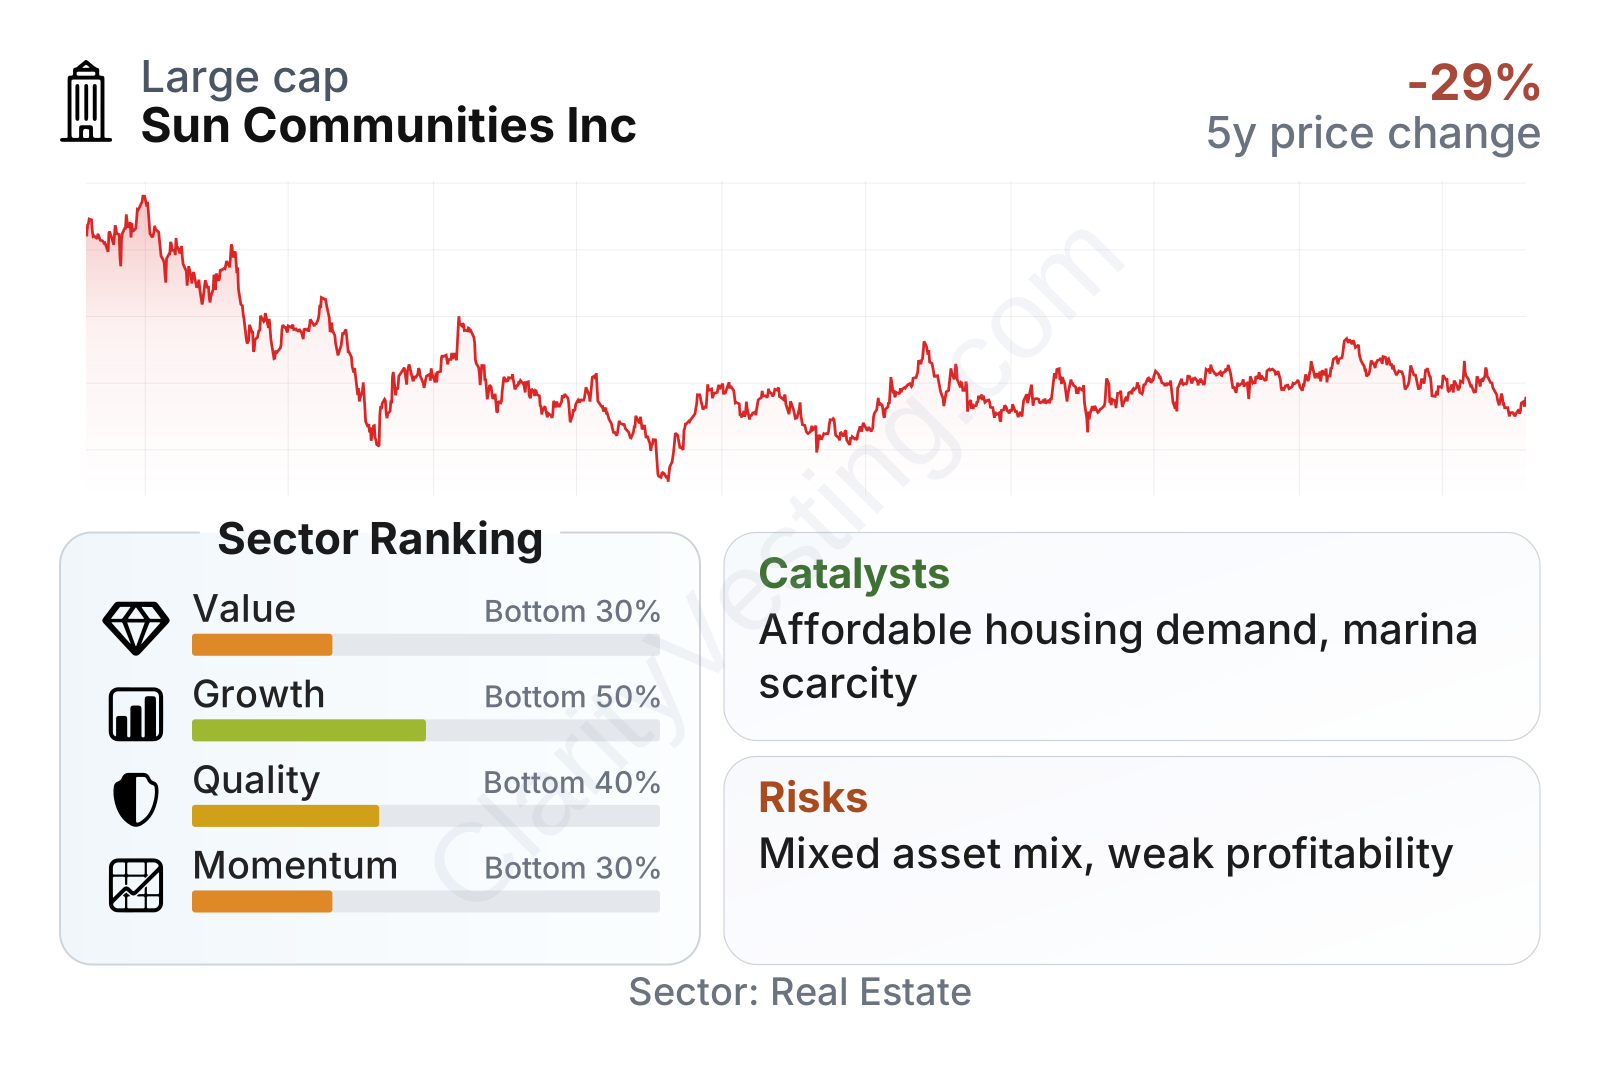
Sun is a large residential REIT with a relatively low share-price volatility profile, but its current metrics look weaker than much of the sector on value, quality, growth, and momentum. The most striking points are a very high earnings multiple, modest free cash flow yield versus peers, weak profitability ratios, and slower recent growth. On the positive side, leverage relative to EBITDA is not stretched versus the sector median, and interest coverage remains serviceable.
The stock-price history also helps frame expectations. After peaking in late 2021, the shares went through a sharp reset during the higher-rate environment and have since moved in a choppier range rather than returning to the earlier highs. That pattern suggests the market has become more cautious about the company’s growth rate, financing costs, and asset quality mix.
Growth
Sun operates in property categories that still have long-term demand drivers. Manufactured housing remains one of the more affordable forms of housing in the United States, which supports occupancy and rent growth over time. Marinas benefit from limited waterfront supply and high replacement costs. RV and holiday park assets are tied more closely to travel and leisure spending, so they can bring upside when consumer demand is healthy, but they are also more cyclical.
The company’s strategy broadly makes sense: combine defensive housing-oriented assets with experience-based properties that can produce pricing power in attractive locations. Scale can also help with operating efficiencies, financing access, and cross-platform customer reach. For long-term observers, the key question is not whether the assets are useful, but whether Sun can turn that scale into steadier per-share growth.
Revenue per share improved from 2021 through 2023, stayed roughly flat in 2024, and then dropped sharply in 2025. That pattern indicates that portfolio changes and capital allocation have recently mattered as much as simple revenue expansion. For a REIT, per-share progress is more important than raw company growth because acquisitions financed with debt or new shares do not automatically create value for existing shareholders.
The dividend trend looks strong over five years, including a major step-up in 2025. That supports the view that management has been willing to return meaningful cash to shareholders. Still, when dividend growth moves much faster than revenue per share, it raises the importance of checking sustainability against recurring cash flow rather than looking only at the payout headline.
One meaningful catalyst is the continuing shortage of affordable housing, which supports demand for manufactured housing communities. Another is the scarcity value of quality marina assets, where barriers to new supply are often high because waterfront properties are difficult to replicate. In addition, any improvement in interest-rate conditions could help REIT valuations and reduce financing pressure across the sector.
Recent company updates have also highlighted portfolio simplification and capital recycling. If Sun continues selling non-core assets and emphasizing higher-quality properties with steadier cash generation, that could improve the market’s view of the business over time. The largest opportunity is likely not dramatic unit growth, but cleaner execution and better cash-flow consistency from the existing platform.
Risks
This article is for informational purposes only and does not constitute financial advice. Some content is AI-generated. See Disclaimer


