Stock Analysis · Sun Hung Kai Properties Ltd (SUHJY)
Overview
Sun Hung Kai Properties Ltd is one of Hong Kong’s largest property companies. Its core business is developing, owning, and managing real estate, with a strong focus on residential projects, office towers, shopping malls, and other recurring-rent assets. The group is best known for combining property development profits with a large investment property portfolio that produces rental income over time. This matters for long-term analysis because it gives the company two different earnings engines: property sales, which can be cyclical, and leasing income, which is usually steadier.
Based on the company’s latest annual reporting structure, revenue mainly comes from the following activities:
- Property sales: the largest contributor, coming from the sale of residential, commercial, and mixed-use developments in Hong Kong and mainland China.
- Rental income from investment properties: a major source of recurring revenue from offices, retail malls, serviced apartments, and other leased assets.
- Hotels, telecommunications, transport, and other related businesses: a smaller but diversified contribution, including hospitality and selected non-property operations.
- Property management and other real-estate services: a relatively modest source tied to estate management and support services.
The exact split can vary significantly from year to year because development revenue depends on when projects are completed and handed over. In practice, property sales usually account for the majority of reported revenue, while rental operations represent a smaller share of revenue but often a more stable and strategically important profit base because premium office and retail assets tend to produce recurring cash flow.
The broader financial flow also highlights an important feature of the business: revenue has recently moved higher, but gross profit has not kept pace, indicating pressure from mix, construction costs, or weaker development margins. Even so, operating profit and net income remain substantial, showing that the company still converts a meaningful portion of sales into earnings.
Key Figures
| Metric | Value | Sector ⓘ |
|---|---|---|
| Date | Nov 21, 2026 | |
| Context | ||
| Sector | Real Estate | |
| Industry | Real Estate - Development | |
| Market Cap ⓘ | $40.74B | |
| Beta ⓘ | 0.79 | |
Value (Cheapness) | ||
| P/E Ratio ⓘ | 14.80 | 17.59 |
| P/B Ratio ⓘ | N/A | 1.58 |
| FCF Yield ⓘ | 18.65% | 5.76% |
| Dividend Yield ⓘ | 3.55% | 4.81% |
| EBIT / EV ⓘ | 14.45% | 4.97% |
| PEG ⓘ | 1.25 | |
Growth (Business expansion) | ||
| Revenue Growth ⓘ | 4.30% | 5.70% |
| RPS Growth (5Y CAGR) ⓘ | 4.93% | 5.96% |
| EPS Growth (5Y CAGR) ⓘ | 44.45% | -3.46% |
| BVPS Growth (5Y CAGR) ⓘ | 1.32% | 0.32% |
| Margin Growth (5Y Trend) ⓘ | -11.63% | -0.65% |
| FCF Growth (5Y CAGR) ⓘ | 38.99% | 5.08% |
| DPS Growth (5Y CAGR) ⓘ | -6.52% | 5.00% |
Quality (Business durability) | ||
| ROIC (Latest) ⓘ | N/A | 5.13% |
| ROE (Latest) ⓘ | 6.62% | 7.64% |
| ROA (Latest) ⓘ | 5.00% | 3.05% |
| ROIC (5Y Median) ⓘ | 3.24% | 4.20% |
| ROE (5Y Median) ⓘ | 3.42% | 6.03% |
| ROA (5Y Median) ⓘ | 2.61% | 2.41% |
| Net Debt / EBIT (Latest) ⓘ | 1.21 | 7.59 |
| Net Debt / EBIT (5Y Median) ⓘ | 4.11 | 8.34 |
| Net Debt / EBITDA (Latest) ⓘ | 1.03 | 5.43 |
| Net Debt / Assets ⓘ | 8.27% | 38.21% |
| EBITDA / Interest ⓘ | 14.01 | 4.20 |
| Operating Margin (Latest) ⓘ | 32.06% | 34.59% |
| Operating Margin (5Y Median) ⓘ | 38.07% | 37.64% |
| Debt to Equity (Latest) ⓘ | 15.41% | 90.32% |
| Profit Margin (Latest) ⓘ | 22.75% | 20.10% |
| Free Cash Flow (Latest) ⓘ | $7.60B | |
Momentum (Price trend) | ||
| 3Y Return ⓘ | +52.68% | +27.88% |
| 12M Return (excl. last month) ⓘ | +14.60% | +1.16% |
| 6M Return ⓘ | -18.51% | -3.06% |
| Price vs. 200-Day MA ⓘ | -9.19% | -0.73% |
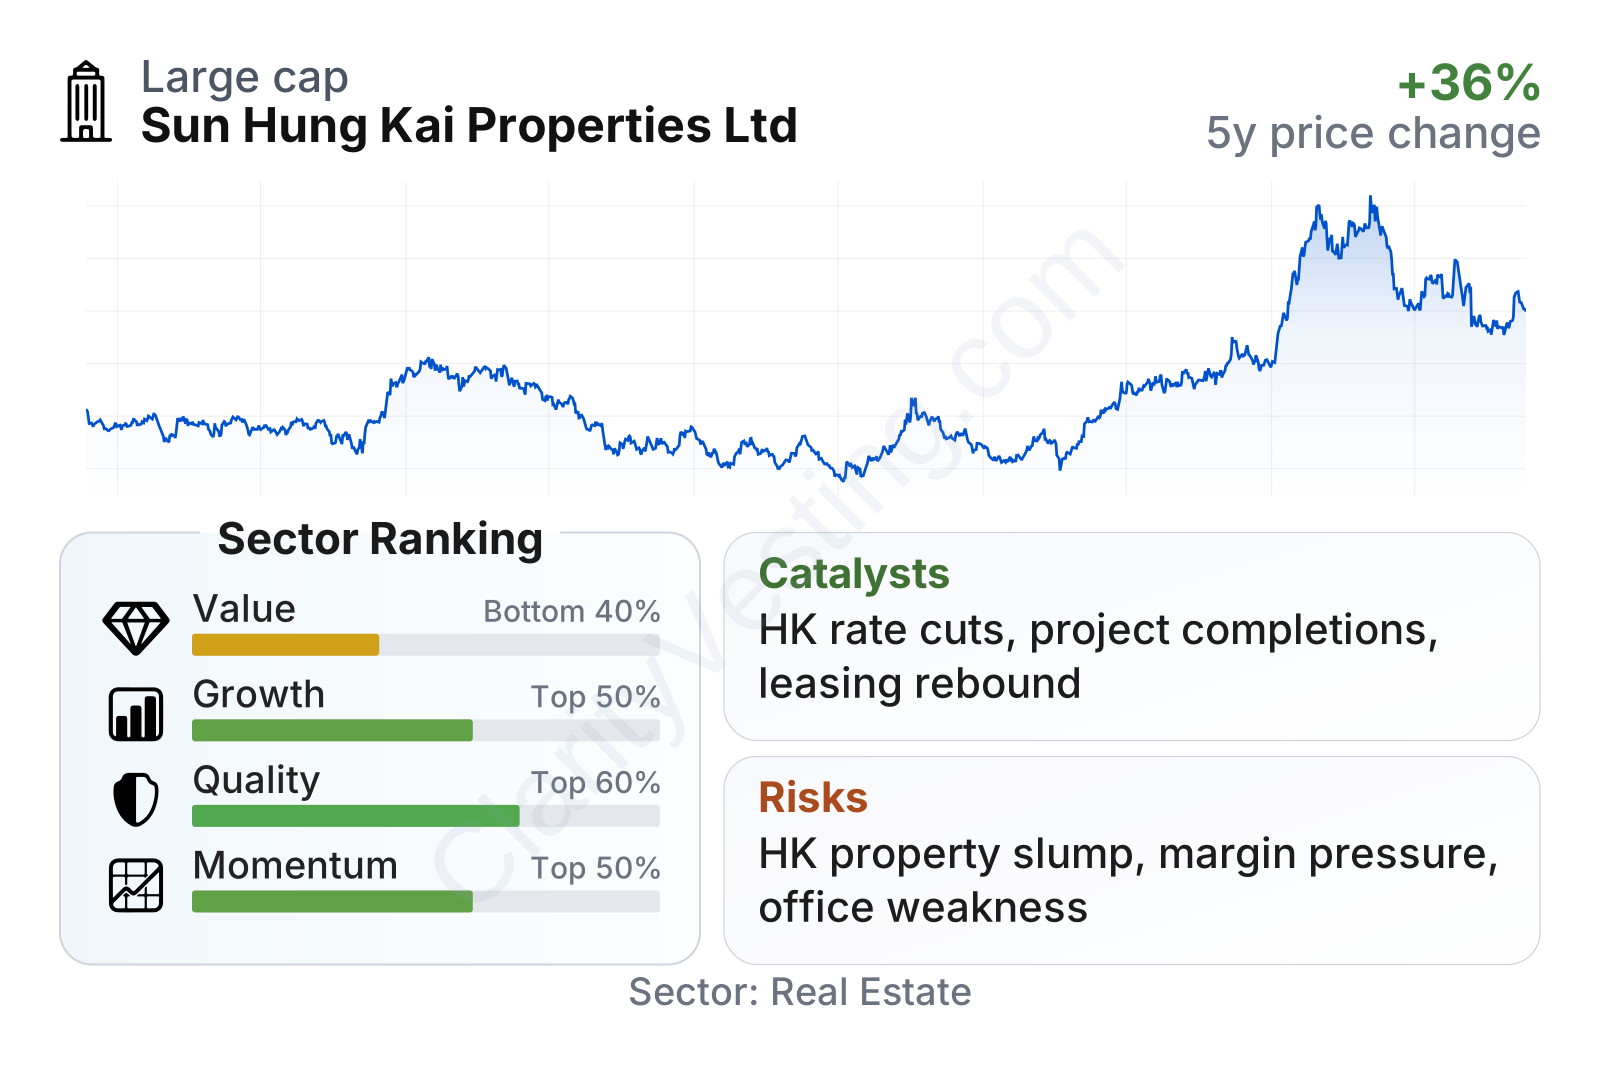
Sun Hung Kai Properties is a large-cap real estate company with a relatively low beta of about 0.8, meaning the share price has historically moved less sharply than the broader market. On valuation, the picture is mixed: earnings-based multiples are not demanding compared with the sector median, and cash generation metrics look notably strong, but the overall value ranking still sits in the lower part of the sector because the dividend yield is below the sector median and real estate valuation metrics can be heavily influenced by asset appraisals and cycle timing.
Quality looks solid rather than exceptional. Profit margin is above the sector median, return on assets is clearly stronger than many peers, and leverage is conservative for a property developer. Growth indicators are more uneven: five-year earnings and free cash flow trends have been strong, while revenue growth and margin direction have been less impressive. Price momentum has been favorable over longer periods, although more recent trading has softened.
Growth
Sun Hung Kai Properties operates in a sector that is mature rather than structurally fast-growing. Hong Kong real estate is driven by land supply, interest rates, office demand, retail activity, and household confidence. That means the company is not in a classic high-growth industry, but it does operate in a market where premium assets, scarce land, and strong balance sheets can still create long-duration value if management allocates capital well.
The company’s strategy remains logical for future growth. It continues to rely on a combination of project development and ownership of income-producing properties. That combination can work well over long periods because development creates bursts of profit and asset recycling opportunities, while the rental portfolio provides continuity. The group’s scale, brand, access to prime sites, and execution record in Hong Kong are meaningful advantages in this model.
Recent operating trends show measured growth rather than rapid expansion. Revenue per share has generally moved upward over five years, with a visible acceleration in the latest period after a softer stretch. That suggests earnings power can recover when project completions improve and market conditions become less restrictive.
Another potential support for long-term growth is the company’s very strong cash generation. Free cash flow yield is well above the sector median, which gives the group flexibility to fund development, support dividends, manage debt conservatively, and wait through weak property cycles without the same pressure faced by more leveraged peers.
Dividend progression has been less smooth. The longer-term trend has been negative on the growth metric, and the series shows clear variability. For a long-term reader, that suggests income stability should be viewed alongside property-cycle exposure rather than treated like a bond-like payment stream.
As for catalysts, the most important ones are tied to the property cycle. Lower financing costs in Hong Kong would likely help affordability, asset values, and market sentiment. A recovery in office and retail leasing conditions would support recurring income from the investment property base. New project completions and successful launches can also lift reported revenue sharply in a given year because the business recognizes development sales upon completion. In addition, any stabilization in mainland China commercial property conditions would reduce one area of uncertainty for diversified Hong Kong developers.
Recent company updates have also shown continued investment in large-scale development pipelines and premium commercial assets, which is consistent with its long-standing strategy of emphasizing prime locations and recurring property income. That does not remove cyclicality, but it does support the idea that growth is likely to come from disciplined asset ownership and project timing rather than aggressive expansion.
Risks
This article is for informational purposes only and does not constitute financial advice. Some content is AI-generated. See Disclaimer