Stock Analysis · StubHub Holdings Inc (STUB)
Overview
StubHub Holdings Inc operates an online marketplace for live event tickets. In simple terms, it connects people who want to buy tickets for concerts, sports, theater, comedy, and other entertainment events with people or organizations that have tickets to sell. The company makes money by facilitating these transactions rather than by producing the events themselves.
Its business model is mainly built around ticket marketplace fees and related services tied to ticket transactions. Based on public company disclosures, revenue is primarily generated from the core marketplace, with additional support from services that help sellers list inventory and help buyers complete purchases securely across markets.
The main revenue sources appear to be:
- Ticket marketplace fees and transaction revenue: approximately 85% to 95%. This includes fees charged when tickets are sold on the platform and is the core of the business.
- Fulfillment, distribution, and related service revenue: approximately 5% to 15%. This can include services around ticket delivery, order processing, and seller tools.
StubHub’s economics can look attractive at the gross profit level because the platform does not carry the same fixed costs as a venue owner or event promoter. At the same time, marketing, technology, customer support, and seller incentives can materially affect profitability from year to year. The business has also shown that accounting earnings can swing sharply even when revenue remains high, which is important for long-term analysis.
The long-term financial picture shows a platform that scaled revenue strongly from 2021 through 2024, while gross profit also expanded significantly. However, operating and net results became unusually distorted in 2025, driven by a large jump in operating expenses rather than a collapse in demand. That makes it especially important to separate the health of the underlying marketplace from one-off or non-recurring costs.
Key Figures
| Metric | Value | Sector ⓘ |
|---|---|---|
| Date | Oct 31, 2026 | |
| Context | ||
| Sector | Communication Services | |
| Industry | Internet Content & Information | |
| Market Cap ⓘ | $2.15B | |
| Beta ⓘ | N/A | |
Value (Cheapness) | ||
| P/E Ratio ⓘ | N/A | 18.47 |
| FCF Yield ⓘ | 29.42% | 14.23% |
| Dividend Yield ⓘ | N/A | 2.78% |
| EBIT / EV ⓘ | -69.17% | 4.73% |
| PEG ⓘ | N/A | |
Growth (Business expansion) | ||
| Revenue Growth ⓘ | 33.20% | 6.10% |
| RPS Growth (5Y CAGR) ⓘ | 25.32% | 4.57% |
| EPS Growth (5Y CAGR) ⓘ | N/A | -17.96% |
| Margin Growth (5Y Trend) ⓘ | N/A | 1.32% |
| FCF Growth (5Y CAGR) ⓘ | N/A | 5.75% |
| DPS Growth (5Y CAGR) ⓘ | N/A | 5.19% |
Quality (Business durability) | ||
| ROIC (Latest) ⓘ | -31.95% | 9.19% |
| ROIC (5Y Median) ⓘ | N/A | 8.24% |
| Net Debt / EBIT (Latest) ⓘ | N/A | 1.92 |
| Net Debt / EBIT (5Y Median) ⓘ | N/A | 2.88 |
| Net Debt / EBITDA (Latest) ⓘ | N/A | 1.22 |
| Net Debt / Assets ⓘ | -5.34% | 18.63% |
| EBITDA / Interest ⓘ | N/A | 8.36 |
| Operating Margin (Latest) ⓘ | -66.38% | 15.68% |
| Operating Margin (5Y Median) ⓘ | -12.42% | 13.39% |
| Debt to Equity (Latest) ⓘ | 67.20% | 59.65% |
| Profit Margin (Latest) ⓘ | -91.27% | 8.74% |
| Free Cash Flow (Latest) ⓘ | $634.02M | |
Momentum (Price trend) | ||
| 3Y Return ⓘ | N/A | +46.16% |
| 12M Return (excl. last month) ⓘ | -67.73% | +1.26% |
| 6M Return ⓘ | -23.55% | 0.00% |
| Price vs. 200-Day MA ⓘ | -35.53% | +0.87% |
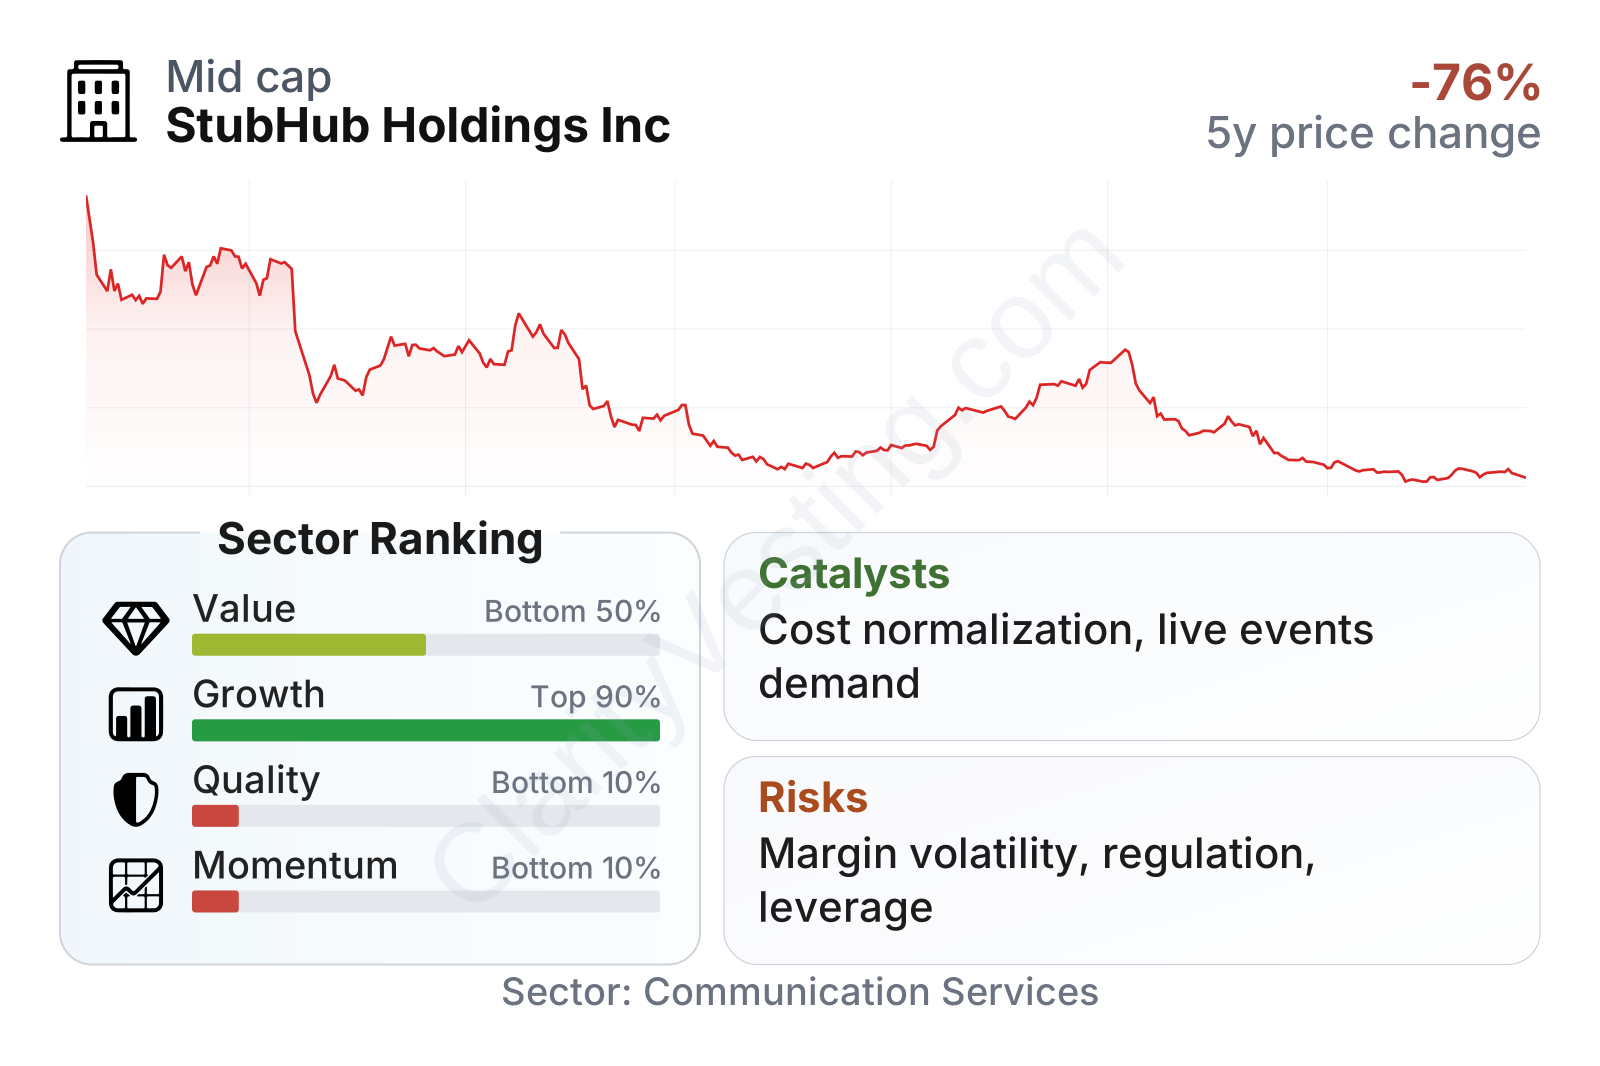
The overall profile is mixed. Growth metrics rank near the top of the sector, helped by revenue growth of roughly 33% year over year and a five-year revenue-per-share growth rate around 25%, both far above sector medians. Value measures are less straightforward: free cash flow yield is very high, but earnings-based measures are distorted by losses. Quality and momentum are currently weak, with negative operating profitability and a share price trend that has been much weaker than the broader sector.
The stock-price history reflects that tension. The market has sharply reduced its expectations over the past year, which usually happens when investors question the durability of profits, the reliability of reported earnings, or the balance between growth and financial discipline.
Growth
StubHub operates in the live entertainment and ticketing market, which remains supported by durable consumer demand for experiences. Over the past several years, concerts, major sports events, and premium live experiences have generally remained resilient categories. This is a favorable backdrop because ticket resale platforms benefit from both strong event demand and price volatility in the secondary market.
The company’s strategy makes sense in principle. A marketplace becomes more useful when it attracts both more buyers and more sellers, and that can create a network effect. If StubHub deepens inventory, improves pricing tools for sellers, and keeps buyer trust high, it can strengthen its position without owning the underlying event assets. That model is capital-light compared with venue operators or promoters.
Financially, the strongest growth signal is the expansion in revenue from about $673 million in 2021 to roughly $1.77 billion in 2024. Even though 2025 revenue was slightly lower, the business remained at a much larger scale than it was a few years earlier. Gross profit also rose meaningfully over that period, suggesting the marketplace itself gained commercial weight.
A key catalyst is operating normalization. In 2025, selling, general, and administrative costs surged to a level that overwhelmed revenue and pushed operating income deeply negative. If that spike was tied to exceptional items rather than a permanent change in cost structure, then future reported earnings could look very different from the recent headline loss. Another possible catalyst is continued recovery and expansion in international live events and high-demand premium ticket categories, where resale activity can be especially active.
Recent corporate developments also matter. StubHub returned to the public market recently, which can improve its access to capital and raise its visibility with commercial partners. That does not guarantee better performance, but it can support investments in technology, brand, and market expansion if execution is strong.
Risks
This article is for informational purposes only and does not constitute financial advice. Some content is AI-generated. See Disclaimer


