Stock Analysis · State Street Corp (STT)
Overview
State Street Corporation is a large financial institution focused on serving other institutions rather than everyday retail banking customers. Its core role is helping asset managers, pension funds, sovereign wealth funds, insurers, endowments, and other large investors safeguard assets, process trades, keep records, calculate fund values, provide data and analytics, and manage investment portfolios. In simple terms, it operates important back-office and investment functions for the global financial system.
The business is mainly organized around two engines: fee-based services and fee-based asset management, with a smaller contribution from spread and financing income. State Street’s best-known subsidiary in asset management is State Street Global Advisors, one of the world’s largest ETF and index investing providers.
Based on recent company reporting, the main revenue sources can be summarized approximately as follows:
- Servicing fees: about 35% to 40% — custody, fund accounting, administration, transfer agency, recordkeeping, and related services for institutional clients.
- Management fees: about 20% to 25% — investment management revenue, mainly from index funds, ETFs, cash products, and institutional mandates through State Street Global Advisors.
- Net interest income: about 15% to 20% — income generated from deposits, securities financing, and the balance sheet spread between interest earned and interest paid.
- Securities finance and other trading-related revenue: about 10% to 15% — foreign exchange trading, securities lending, financing activity, and related market services.
- Software, processing, and other fee revenue: about 10% — data, analytics, front-office and middle-office support, and other specialized institutional services.
One notable trend in recent years is that total revenue has grown strongly, but the path from revenue to profit has been less smooth because funding costs and interest expense became much heavier during the high-rate period. Even so, net income recovered after the 2023 dip and reached a new high in 2025, showing that the business still has meaningful earnings power when operating conditions improve.
Key Figures
| Metric | Value | Sector ⓘ |
|---|---|---|
| Date | Oct 19, 2026 | |
| Context | ||
| Sector | Financial Services | |
| Industry | Asset Management | |
| Market Cap ⓘ | $45.52B | |
| Beta ⓘ | 1.42 | |
Value (Cheapness) | ||
| P/E Ratio ⓘ | 13.54 | 12.26 |
| P/B Ratio ⓘ | 1.61 | 1.23 |
| FCF Yield ⓘ | -11.31% | 10.40% |
| Dividend Yield ⓘ | 2.05% | 3.02% |
| EBIT / EV ⓘ | N/A | 8.14% |
| PEG ⓘ | 0.67 | |
Growth (Business expansion) | ||
| Revenue Growth ⓘ | 13.30% | 9.25% |
| RPS Growth (5Y CAGR) ⓘ | 23.54% | 12.19% |
| EPS Growth (5Y CAGR) ⓘ | 8.80% | -9.36% |
| BVPS Growth (5Y CAGR) ⓘ | 7.96% | 4.99% |
| Margin Growth (5Y Trend) ⓘ | -9.87% | -3.86% |
| FCF Growth (5Y CAGR) ⓘ | N/A | 4.81% |
| DPS Growth (5Y CAGR) ⓘ | 12.50% | 8.79% |
Quality (Business durability) | ||
| ROIC (Latest) ⓘ | 6.29% | 9.49% |
| ROE (Latest) ⓘ | 12.82% | 13.87% |
| ROA (Latest) ⓘ | 0.96% | 1.54% |
| ROIC (5Y Median) ⓘ | 5.45% | 7.86% |
| ROE (5Y Median) ⓘ | 10.22% | 12.17% |
| ROA (5Y Median) ⓘ | 0.83% | 1.30% |
| Net Debt / EBIT (Latest) ⓘ | 4.85 | 0.99 |
| Net Debt / EBIT (5Y Median) ⓘ | -27.22 | 0.73 |
| Net Debt / EBITDA (Latest) ⓘ | 4.03 | 0.91 |
| Operating Margin (Latest) ⓘ | 19.05% | 22.30% |
| Operating Margin (5Y Median) ⓘ | 16.49% | 24.63% |
| Debt to Equity (Latest) ⓘ | 90.68% | 58.04% |
| Profit Margin (Latest) ⓘ | 23.78% | 26.57% |
| Free Cash Flow (Latest) ⓘ | -$5.15B | |
Momentum (Price trend) | ||
| 3Y Return ⓘ | +169.60% | +88.26% |
| 12M Return (excl. last month) ⓘ | +69.80% | +19.24% |
| 6M Return ⓘ | +17.99% | +4.70% |
| Price vs. 200-Day MA ⓘ | +6.51% | +3.66% |
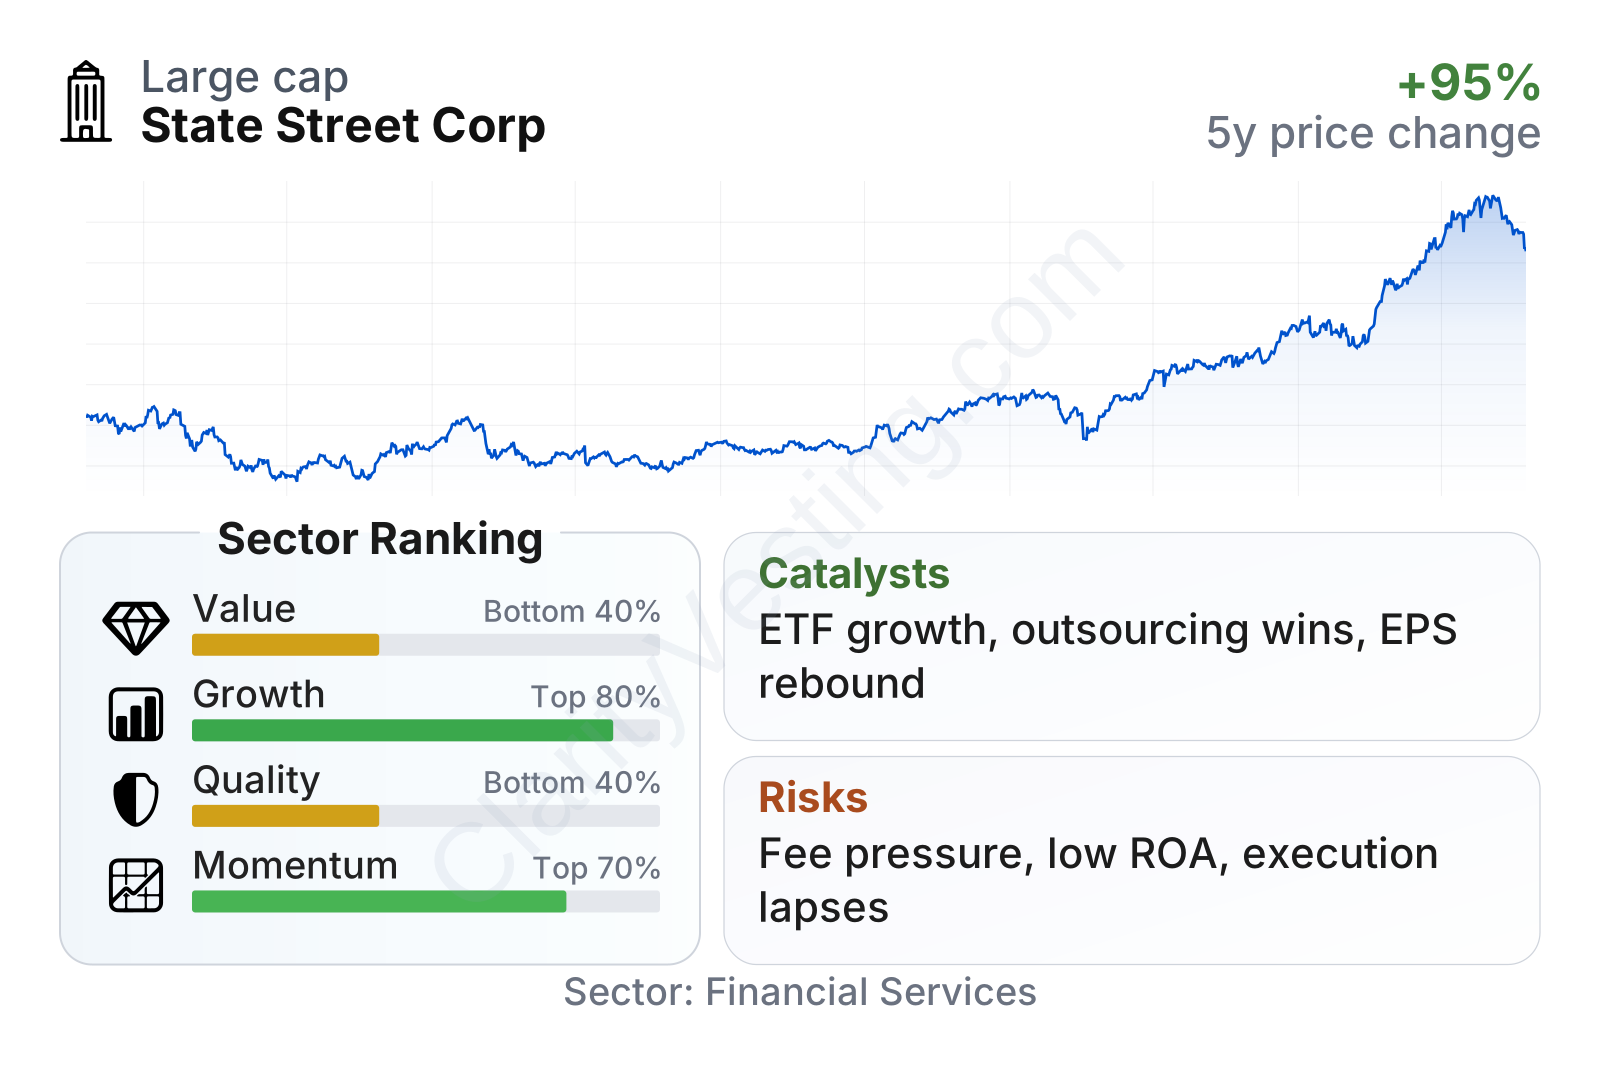
State Street is a large-cap financial company with stronger recent share-price performance than much of its sector, but the underlying profile is mixed. Growth metrics rank well above the sector median, helped by double-digit recent revenue expansion and solid multi-year gains in earnings, book value per share, and dividends per share. By contrast, quality and value measures look less favorable: profitability ratios are generally below sector medians, leverage-related indicators are heavier than many peers, and the stock now trades at somewhat richer valuation multiples than is typical in the sector.
Growth
State Street operates in a sector that has durable long-term support: institutional investing keeps growing, passive investing continues to attract assets, regulation keeps custody and reporting infrastructure essential, and large asset owners increasingly rely on outsourced operating platforms. Those trends are not flashy, but they are sticky. This matters because State Street sits in businesses where scale, trust, and operating reliability are difficult to replicate.
The company’s strategy also fits the direction of the market. It is pushing further into higher-value servicing, outsourced front-to-back solutions, data and software-enabled workflows, and ETF and index-based asset management. That combination can support growth from both rising market levels and deeper client relationships. In practice, the opportunity is not only to win new assets, but also to provide more services around the same assets.
Earnings per share have shown a clear upward trend over the past several years, with a particularly strong step-up in 2024 and 2025. That progression suggests that operating leverage and balance-sheet normalization have started to work in State Street’s favor again after the pressure seen in 2023.
Book value per share has also advanced materially since the 2022 trough. For a custody bank and asset servicer, that is an important sign because it reflects rebuilding capital strength while still supporting dividends and repurchases. The company’s five-year growth in both earnings and book value per share is ahead of the sector median, which supports the view that recent improvement is not only a short-lived rebound.
A major catalyst is the continued expansion of ETFs and index investing, where State Street Global Advisors remains one of the biggest players globally. Another is outsourcing by institutional clients that want to reduce costs and complexity. Higher market levels also help because fee revenue often scales with assets under custody, administration, or management. Recent company updates have also pointed to expense discipline, buybacks, and continued focus on platform efficiency, which can amplify earnings growth if revenue keeps expanding.
Risks
This article is for informational purposes only and does not constitute financial advice. Some content is AI-generated. See Disclaimer


