Stock Analysis · Santos Ltd (STOSF)
Overview
Santos Ltd is an Australian energy producer focused on natural gas and liquefied natural gas, usually called LNG, along with oil and natural gas liquids. The company explores for resources, develops fields, produces hydrocarbons, and sells them into domestic and export markets. Its asset base stretches across Australia, Papua New Guinea, Timor-Leste, and Alaska, giving it exposure to both mature production and long-dated development options.
For a long-term reader, the simplest way to understand Santos is that it is primarily a gas company with LNG infrastructure and reserve depth. That matters because gas is often viewed as a lower-emission fossil fuel than coal in power generation, and LNG remains strategically important in Asia, especially for utilities and industrial buyers seeking reliable imported energy.
Based on company reporting, Santos’ revenue mix is dominated by LNG and gas-linked sales, with oil still meaningful but smaller. A practical breakdown is:
- LNG: approximately 45% to 55% of revenue. This includes LNG sold from major projects such as PNG LNG, GLNG, Darwin LNG, and other linked operations.
- Natural gas and pipeline gas: approximately 20% to 30%. This includes domestic gas supply to Australian commercial, industrial, and utility customers.
- Crude oil and condensate: approximately 15% to 25%. These liquids are typically tied to upstream production from the company’s operated and non-operated fields.
- LPG, ethane, and other products: generally below 10%. These are smaller associated revenue streams linked to processing and field output.
Santos is not a niche producer. It is a large regional energy company with integrated positions in upstream production and LNG export chains, which gives it more resilience than a pure explorer. The business model is still highly tied to commodity prices, but its gas weighting makes it different from companies that rely mainly on crude oil.
Over the last several years, revenue and profit have moved sharply with energy markets. The broad pattern has been a peak during the 2022 energy shock, followed by normalization as prices cooled. Even so, the company has remained profitable and cash generative, which is an important baseline for long-term analysis.
The operating flow shows how strongly results expanded in 2022 and then moderated afterward. Even with lower revenue since that peak, Santos has preserved meaningful operating income, suggesting the business still has a workable cost base when market conditions are less favorable.
Key Figures
| Metric | Value | Sector ⓘ |
|---|---|---|
| Date | Sep 29, 2026 | |
| Context | ||
| Sector | Energy | |
| Industry | Oil & Gas E&P | |
| Market Cap ⓘ | $21.21B | |
| Beta ⓘ | -0.09 | |
Value (Cheapness) | ||
| P/E Ratio ⓘ | 28.39 | 14.98 |
| P/B Ratio ⓘ | 1.36 | 1.58 |
| FCF Yield ⓘ | 3.28% | 8.43% |
| Dividend Yield ⓘ | 3.08% | 3.78% |
| EBIT / EV ⓘ | N/A | 7.44% |
| PEG ⓘ | N/A | |
Growth (Business expansion) | ||
| Revenue Growth ⓘ | 1.60% | 27.35% |
| RPS Growth (5Y CAGR) ⓘ | -7.33% | 6.80% |
| EPS Growth (5Y CAGR) ⓘ | 42.66% | -16.17% |
| BVPS Growth (5Y CAGR) ⓘ | -6.52% | 6.98% |
| Margin Growth (5Y Trend) ⓘ | -0.78% | 1.47% |
| FCF Growth (5Y CAGR) ⓘ | -13.89% | 3.77% |
| DPS Growth (5Y CAGR) ⓘ | 24.25% | 16.93% |
Quality (Business durability) | ||
| ROIC (Latest) ⓘ | N/A | 11.33% |
| ROA (Latest) ⓘ | 5.13% | 6.06% |
| ROIC (5Y Median) ⓘ | 6.86% | 10.25% |
| ROA (5Y Median) ⓘ | 4.12% | 5.34% |
| Net Debt / EBIT (Latest) ⓘ | N/A | 1.74 |
| Net Debt / EBIT (5Y Median) ⓘ | 2.43 | 1.93 |
| Net Debt / EBITDA (Latest) ⓘ | 1.29 | 1.10 |
| Net Debt / Assets ⓘ | 20.38% | 17.29% |
| EBITDA / Interest ⓘ | 13.77 | 9.03 |
| Operating Margin (Latest) ⓘ | N/A | 16.56% |
| Operating Margin (5Y Median) ⓘ | 35.83% | 19.53% |
| Debt to Equity (Latest) ⓘ | 46.82% | 53.34% |
| Profit Margin (Latest) ⓘ | 14.74% | 8.79% |
| Free Cash Flow (Latest) ⓘ | $694.57M | |
Momentum (Price trend) | ||
| 3Y Return ⓘ | +59.13% | +64.72% |
| 12M Return (excl. last month) ⓘ | +18.83% | +44.70% |
| 6M Return ⓘ | +20.93% | +0.24% |
| Price vs. 200-Day MA ⓘ | +33.31% | +7.56% |
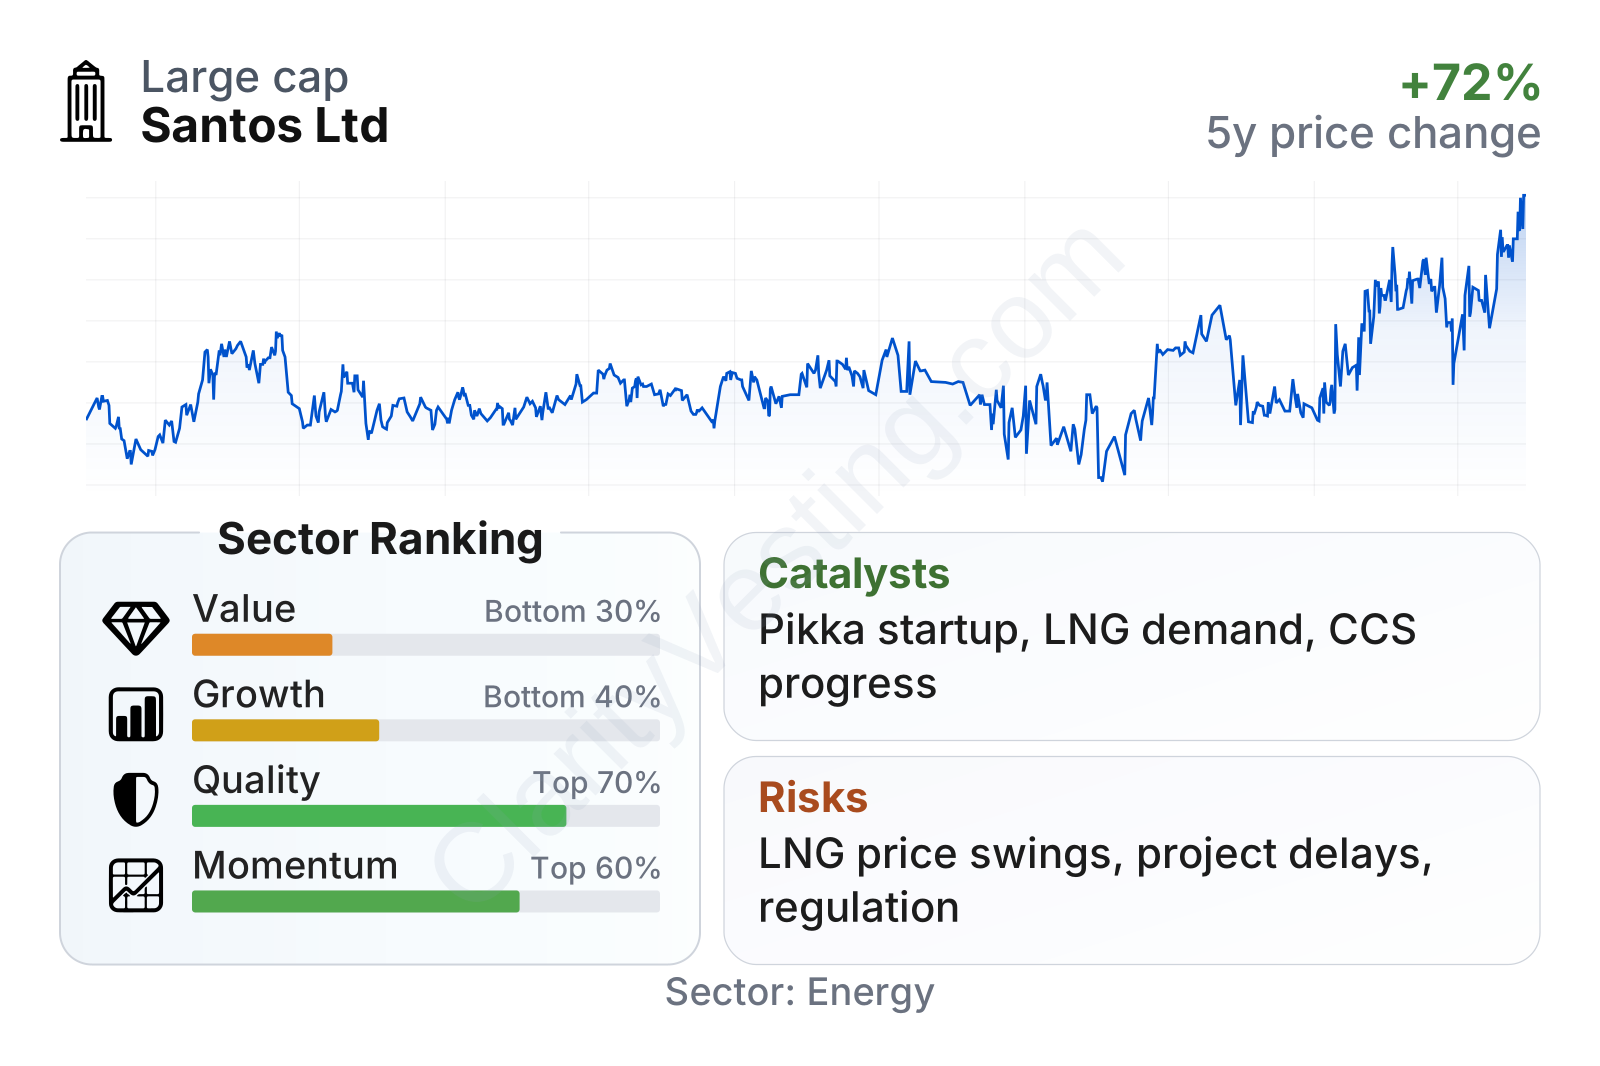
Santos sits in the large-cap range for its peer group, with mixed factor signals. Profitability and balance-sheet discipline look better than many sector peers, while growth and valuation metrics look less favorable. The market has rewarded the shares recently, but the stock also appears to be pricing in a degree of stability and future project value rather than just current earnings.
The recent share-price trend has been constructive, with strong gains over the last six months and the stock trading well above its long-term moving average. At the same time, headline valuation is not obviously cheap: the earnings multiple is well above the sector median, while free-cash-flow yield and dividend yield sit below typical peer levels. That combination usually means the market is assigning a premium to asset quality, LNG exposure, or expected future development upside.
Growth
Santos operates in a sector that still has a long runway, especially in LNG and regional gas supply. The long-term case does not depend on fast global oil demand growth. Instead, it rests more on continued Asian LNG demand, domestic gas security needs in Australia, and the company’s ability to bring additional low-cost gas volumes to market. In that sense, its strategic focus makes industrial sense: it is more aligned with gas demand and export infrastructure than with high-risk frontier oil exploration alone.
The company’s strategy has centered on a few clear priorities: extending the life of core assets, expanding LNG-linked supply, developing major resource positions such as Pikka in Alaska, and supporting carbon capture and storage projects intended to lower emissions intensity. For a business in hydrocarbons, that is a relatively coherent playbook. It combines near-term cash flow from existing production with longer-duration growth projects that could support output beyond the current asset base.
Revenue growth has been weak in the most recent periods after exceptionally strong gains in 2021 and 2022. That does not automatically point to an operational problem, because energy producers often see revenue swing mainly due to commodity prices. Still, compared with the broader sector, Santos has recently trailed on top-line momentum, so future production additions matter more than they would for a rapidly growing producer.
Free cash flow has historically been strong enough to support dividends, debt management, and project spending, although the latest trailing figure is well below the peak levels seen during the energy price spike. For a long-term view, the key question is less about repeating the 2022–2023 cash surge and more about whether Santos can generate durable cash through the cycle while funding its large developments.
One major catalyst is project execution. The Pikka development in Alaska is a particularly important future source of production growth. If the project continues on schedule and budget, it could add meaningful volume and diversify the company further. Another catalyst is LNG market tightness in Asia, where contracting activity and supply concerns can support stronger realized prices. Santos also continues to push carbon capture and storage initiatives, which may help preserve market access and improve the profile of its gas portfolio if regulation becomes stricter.
Recent company updates have also highlighted ongoing portfolio optimization, disciplined capital allocation, and steady operational delivery from major LNG-linked assets. None of that creates instant growth, but it can support a more durable production base over time.
Risks
This article is for informational purposes only and does not constitute financial advice. Some content is AI-generated. See Disclaimer


