Stock Analysis · Equinor ASA (STOHF)
Overview
Equinor ASA is a large Norwegian energy company best known for producing oil and natural gas, while also building a growing business in offshore wind, carbon storage, and other lower-carbon energy activities. The company operates across the full chain of the oil and gas business: exploring for resources, developing fields, producing hydrocarbons, transporting them, processing them, and selling them into global markets. Norway remains the company’s core base, but Equinor also has material operations in international offshore areas, including the U.S. Gulf of Mexico, Brazil, and the U.K.
For long-term analysis, the key point is that Equinor is still primarily an oil and gas company, even though it is positioning itself for a broader energy mix over time. Its earnings and cash generation remain closely tied to commodity prices, production volumes, and European gas market conditions. At the same time, its portfolio includes some of the world’s strongest offshore positions and a meaningful presence in Europe’s energy security system.
Based on the company’s recent annual reporting structure, the main revenue sources can be summarized approximately as follows:
- Marketing, midstream and processing: about 55% to 65% of revenue. This includes trading, transportation, processing, and sales of crude oil, refined products, natural gas, natural gas liquids, power, and related energy products.
- Norwegian oil and gas production: about 20% to 30% of revenue. This is upstream production from the Norwegian continental shelf, which is the company’s most strategic asset base and a major source of profit.
- International oil and gas production: about 10% to 20% of revenue. This includes upstream operations outside Norway, notably in the Americas and other offshore regions.
- Renewables and low-carbon activities: currently a small single-digit share of revenue. This includes offshore wind, carbon capture and storage, and related energy transition projects. Revenue contribution is still limited compared with hydrocarbons, but capital deployment and strategic importance are increasing.
Equinor’s financial profile shows how dominant its hydrocarbon business still is. Revenue remained above $100 billion in 2024 and 2025, but profit conversion weakened meaningfully from the extraordinary 2022 peak as energy prices normalized. The broad pattern is a company with very large scale, strong operating profitability, and heavy tax exposure, especially in Norway.
The long-term picture is clear: sales and operating income are still substantial, but net income has become much more sensitive to lower commodity prices and taxation than headline revenue alone might suggest.
Key Figures
| Metric | Value | Sector ⓘ |
|---|---|---|
| Date | Oct 10, 2026 | |
| Context | ||
| Sector | Energy | |
| Industry | Oil & Gas Integrated | |
| Market Cap ⓘ | $102.00B | |
| Beta ⓘ | -0.66 | |
Value (Cheapness) | ||
| P/E Ratio ⓘ | 11.73 | 14.91 |
| P/B Ratio ⓘ | 2.44 | 1.67 |
| FCF Yield ⓘ | 9.26% | 8.53% |
| Dividend Yield ⓘ | 3.57% | 3.63% |
| EBIT / EV ⓘ | 32.17% | 7.44% |
| PEG ⓘ | 1.19 | |
Growth (Business expansion) | ||
| Revenue Growth ⓘ | 37.40% | 27.10% |
| RPS Growth (5Y CAGR) ⓘ | 11.32% | 6.85% |
| EPS Growth (5Y CAGR) ⓘ | -18.99% | -15.33% |
| BVPS Growth (5Y CAGR) ⓘ | 6.65% | 6.02% |
| Margin Growth (5Y Trend) ⓘ | -10.17% | 0.64% |
| FCF Growth (5Y CAGR) ⓘ | -26.23% | 3.59% |
| DPS Growth (5Y CAGR) ⓘ | 36.12% | 16.79% |
Quality (Business durability) | ||
| ROIC (Latest) ⓘ | 13.75% | 11.33% |
| ROA (Latest) ⓘ | 6.55% | 6.03% |
| ROIC (5Y Median) ⓘ | 12.54% | 10.19% |
| ROA (5Y Median) ⓘ | 6.41% | 5.40% |
| Net Debt / EBIT (Latest) ⓘ | 0.68 | 1.60 |
| Net Debt / EBIT (5Y Median) ⓘ | 0.75 | 1.91 |
| Net Debt / EBITDA (Latest) ⓘ | 0.54 | 1.05 |
| Net Debt / Assets ⓘ | 17.29% | 17.29% |
| EBITDA / Interest ⓘ | 27.09 | 9.65 |
| Operating Margin (Latest) ⓘ | 31.32% | 16.21% |
| Operating Margin (5Y Median) ⓘ | 35.22% | 19.99% |
| Debt to Equity (Latest) ⓘ | 75.28% | 54.41% |
| Profit Margin (Latest) ⓘ | 7.97% | 8.79% |
| Free Cash Flow (Latest) ⓘ | $9.45B | |
Momentum (Price trend) | ||
| 3Y Return ⓘ | +76.20% | +70.76% |
| 12M Return (excl. last month) ⓘ | +85.95% | +46.44% |
| 6M Return ⓘ | +2.64% | +0.36% |
| Price vs. 200-Day MA ⓘ | +36.74% | +8.00% |
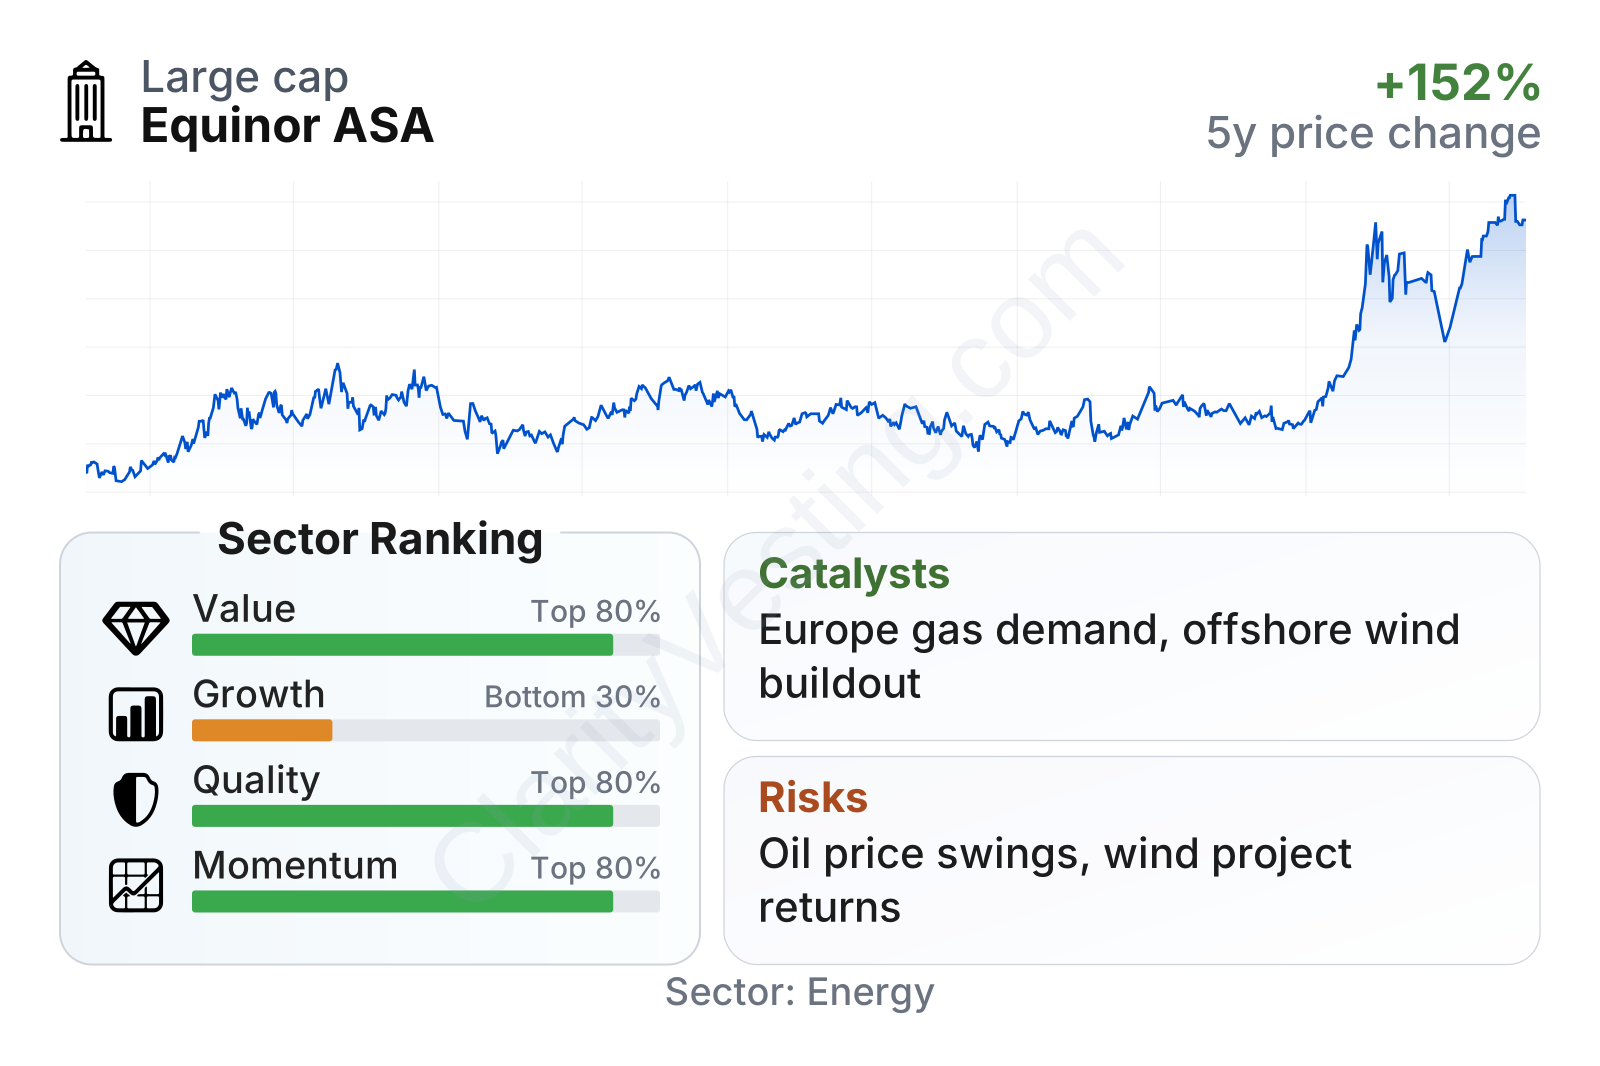
Equinor stands out as a very large energy company with a market value around $100 billion. In the current snapshot, the company ranks well on value, quality, and market performance versus much of the energy sector, while its growth profile looks weaker when judged over a multi-year period. The valuation multiples remain moderate, free cash flow yield is above the sector median, and operating returns are solid. On the other hand, earnings growth over five years has been pressured by the sector’s boom-and-normalization cycle, which helps explain why headline growth scores look less favorable than recent share-price strength.
The stock price chart shows a sharp re-rating in 2026 after a long period of more modest movement. That move suggests the market has recently become more constructive on Equinor’s cash generation, asset base, or exposure to stronger gas and oil conditions, but it also means the market is no longer treating the company as cheaply as it did during weaker sentiment phases.
Growth
Equinor operates in a sector that is growing in two very different ways at once. Traditional oil and gas demand remains large, especially for natural gas, LNG-linked supply, petrochemicals, shipping, and energy security needs. At the same time, long-term capital is increasingly shifting toward lower-carbon power, offshore wind, and carbon management. Equinor’s strategy is built around serving both trends: defending a high-quality upstream portfolio while gradually expanding in transition businesses where it has technical overlap, especially offshore engineering and large-scale project execution.
That strategy makes sense on paper because the company’s legacy strengths are real. Equinor is deeply experienced in offshore resource development, subsea systems, harsh-environment operations, and large infrastructure projects. Those skills transfer more naturally into offshore wind and carbon storage than they would for many land-based oil producers. The company is not trying to become a pure renewable utility overnight; instead, it is using cash flows from hydrocarbons to fund a more gradual transition.
Recent revenue growth has been volatile rather than consistently upward. That is normal for a company exposed to oil and gas prices. The latest year-over-year rebound is notable, but it follows several uneven quarters. For a long-term reader, the important takeaway is that reported growth should be read as cyclical, not as a smooth business expansion trend.
Free cash flow has also come down sharply from the exceptional levels seen during the energy price spike. Even so, Equinor still generates meaningful cash, and that matters because it supports capital spending, dividends, buybacks when authorized, and low-carbon investment without stretching the balance sheet too aggressively. The main growth question is therefore not whether Equinor can produce cash, but whether it can deploy that cash into projects that remain attractive after the oil-and-gas windfall period.
Several catalysts could support future expansion. Natural gas remains strategically important for Europe, and Equinor is one of the most important suppliers into that system. The company is also progressing offshore wind and carbon storage developments, which could become more financially relevant over time if project economics improve and policy support remains durable. In addition, its international portfolio gives it optionality: Brazil and the U.S. Gulf of Mexico can add production and diversify away from Norway.
Recent company updates have also pointed to continued investment in high-return oil and gas projects alongside selective development of transition assets. That combination is significant because the near-term economics of hydrocarbons still fund the broader corporate strategy. If commodity markets remain supportive and project execution stays disciplined, Equinor has a credible path to balancing current cash returns with future repositioning.
Risks
This article is for informational purposes only and does not constitute financial advice. Some content is AI-generated. See Disclaimer


