Stock Analysis · Stockland (STKAF)
Overview
Stockland is one of Australia’s largest real estate groups. It develops, owns, and manages a mix of residential communities, land lease communities, logistics assets, retail town centers, and workplace properties. The business is structured to combine recurring property income with development profits from selling homesites and completing projects. That mix makes it broader than a pure shopping-center landlord or a pure homebuilder.
Based on the company’s recent annual reporting, revenue and operating earnings are mainly supported by three broad engines:
- Residential development: approximately 45% to 55% of group activity in recent years. This includes masterplanned communities, land subdivision, apartment development, and related settlement revenue.
- Commercial Property: approximately 30% to 40%. This covers rental income and valuation-related contributions from logistics, retail, and workplace assets.
- Land lease communities and other activities: approximately 10% to 20%. This includes communities aimed at lifestyle and retirement-adjacent housing demand, plus smaller operating lines and strategic investments.
The exact split can vary meaningfully from year to year because property development settlements, asset sales, and property valuation movements can shift reported results. Even so, the central idea is clear: Stockland is exposed both to Australia’s housing demand and to income-producing real estate.
That combination is important for long-term analysis. Residential development can be more cyclical, but rental-producing assets can help smooth earnings and cash generation over time. Recent financial trends also show total revenue rising from about A$2.8 billion to about A$3.6 billion over the last five reported fiscal years, while operating income has expanded more strongly than sales, pointing to improved efficiency and stronger contribution from the portfolio mix.
The business flow has become more favorable over time. Revenue has moved higher, operating income has grown faster than overhead, and interest expense has stayed relatively contained despite a higher-rate environment. That matters for a real estate group, where financing costs often put pressure on profitability.
Key Figures
| Metric | Value | Sector ⓘ |
|---|---|---|
| Date | Oct 17, 2026 | |
| Context | ||
| Sector | Real Estate | |
| Industry | REIT - Diversified | |
| Market Cap ⓘ | $6.71B | |
| Beta ⓘ | 0.94 | |
Value (Cheapness) | ||
| P/E Ratio ⓘ | 9.86 | 17.38 |
| P/B Ratio ⓘ | 0.43 | 0.85 |
| FCF Yield ⓘ | 17.71% | 7.38% |
| Dividend Yield ⓘ | 9.13% | 4.85% |
| EBIT / EV ⓘ | N/A | 3.78% |
| PEG ⓘ | 3.55 | |
Growth (Business expansion) | ||
| Revenue Growth ⓘ | 14.10% | 5.30% |
| RPS Growth (5Y CAGR) ⓘ | 16.12% | 6.02% |
| EPS Growth (5Y CAGR) ⓘ | -6.12% | -11.37% |
| BVPS Growth (5Y CAGR) ⓘ | 10.13% | 0.45% |
| Margin Growth (5Y Trend) ⓘ | 5.67% | -0.22% |
| FCF Growth (5Y CAGR) ⓘ | N/A | 5.40% |
| DPS Growth (5Y CAGR) ⓘ | 1.97% | 5.02% |
Quality (Business durability) | ||
| ROIC (Latest) ⓘ | N/A | 5.69% |
| ROE (Latest) ⓘ | 17.63% | 7.56% |
| ROA (Latest) ⓘ | 9.99% | 2.85% |
| ROIC (5Y Median) ⓘ | 5.50% | 4.22% |
| ROE (5Y Median) ⓘ | 8.23% | 6.03% |
| ROA (5Y Median) ⓘ | 4.75% | 2.44% |
| Net Debt / EBIT (Latest) ⓘ | N/A | 7.59 |
| Net Debt / EBIT (5Y Median) ⓘ | 5.10 | 8.40 |
| Net Debt / EBITDA (Latest) ⓘ | 2.16 | 5.27 |
| Net Debt / Assets ⓘ | 21.95% | 37.76% |
| EBITDA / Interest ⓘ | N/A | 4.10 |
| Operating Margin (Latest) ⓘ | N/A | 35.29% |
| Operating Margin (5Y Median) ⓘ | 26.26% | 37.31% |
| Debt to Equity (Latest) ⓘ | 45.99% | 88.87% |
| Profit Margin (Latest) ⓘ | 25.99% | 19.61% |
| Free Cash Flow (Latest) ⓘ | $1.19B | |
Momentum (Price trend) | ||
| 3Y Return ⓘ | +31.12% | +30.75% |
| 12M Return (excl. last month) ⓘ | -23.21% | +4.36% |
| 6M Return ⓘ | -8.76% | -2.52% |
| Price vs. 200-Day MA ⓘ | -11.90% | -2.34% |
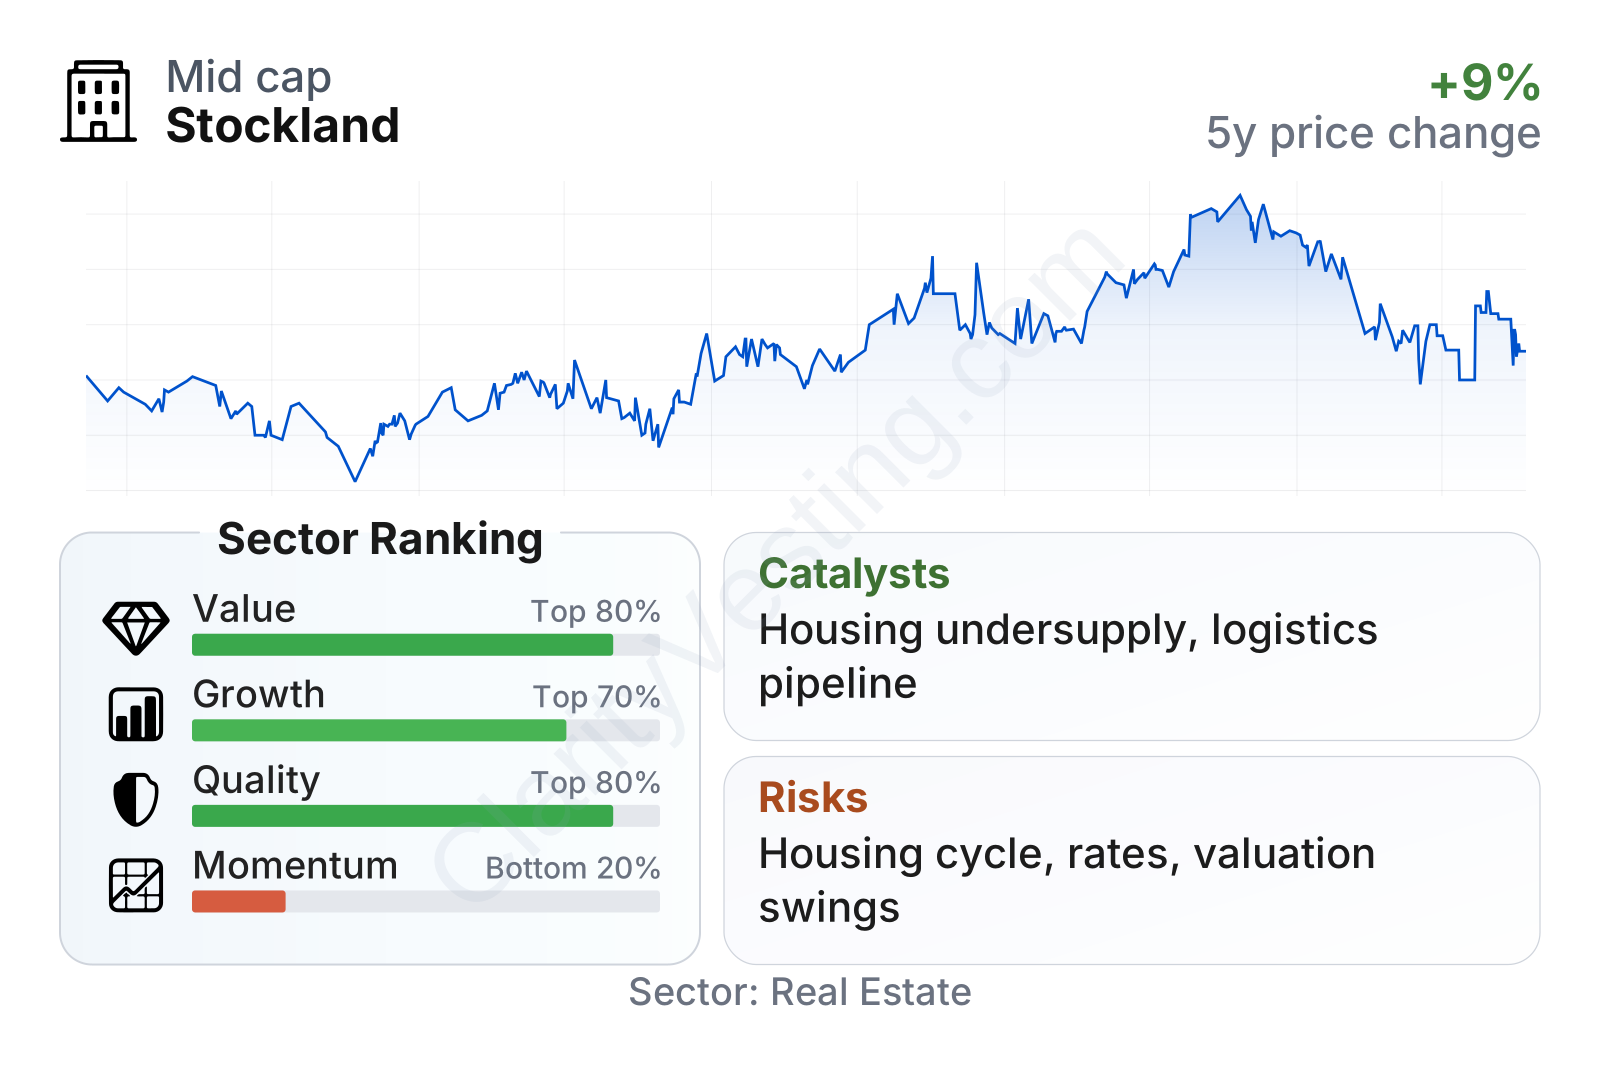
Stockland currently stands out more on valuation, balance-sheet strength, and cash generation than on market momentum. Its value and quality indicators rank well within the real estate sector, with a lower-than-sector price-to-earnings ratio, a much lower price-to-book ratio, a strong free-cash-flow yield, and a dividend yield well above the sector median. Leverage also looks moderate for the industry, with debt-to-equity around 46% and net debt relative to EBITDA clearly below the sector median. On the other hand, recent share-price performance has lagged much of the sector, which helps explain why valuation multiples remain compressed.
The company is mid-to-large in size within listed real estate, and its beta is close to 1, which suggests share-price moves broadly in line with the market rather than at extreme volatility levels.
Growth
Stockland operates in parts of the market that still have meaningful long-term demand support. In Australia, housing supply has remained tight relative to population growth, while logistics property continues to benefit from e-commerce, supply-chain modernization, and demand for well-located industrial space. Land lease communities also sit in an attractive niche, supported by affordability pressures and aging demographics.
The company’s strategy is coherent for that backdrop. Management has spent several years reshaping the portfolio toward areas with stronger structural demand, especially residential communities and logistics, while reducing exposure to weaker segments. That gives Stockland more exposure to housing undersupply and to property types with better long-run tenant demand.
Revenue per share was fairly steady for a period and then rose sharply in the latest year, which suggests improved project delivery and a stronger contribution from the current portfolio mix. Over five years, revenue per share growth has been materially above the sector median, a sign that expansion has not relied only on issuing more equity.
Dividend per share has not moved in a straight line, which is normal for a property group exposed to development cycles, but the longer-term direction has still been upward. The latest recovery is notable because it suggests the company is again translating operating performance into shareholder distributions after a softer period.
A meaningful catalyst is Stockland’s positioning in masterplanned housing communities, where limited housing supply in major Australian markets can support settlements over time. Another is logistics, a segment that tends to attract institutional capital and can benefit from rent growth and development completions. If interest rates stabilize or decline, that could also improve housing affordability, support property valuations, and lower financing pressure across the real estate platform.
Recent company updates have also emphasized project pipeline execution, capital recycling, and continued focus on communities and logistics. Those are practical growth levers because they can unlock value from the land bank, refresh the asset base, and direct capital toward segments with stronger demand than traditional office property.
Risks
This article is for informational purposes only and does not constitute financial advice. Some content is AI-generated. See Disclaimer


