Stock Analysis · St. James’s Place PLC (STJPF)
Overview
St. James’s Place PLC is a U.K.-based wealth management group. It provides financial advice and manages money for individuals, families, and business owners, mainly through a large network of partnered advisers. In simple terms, the company helps clients invest savings, prepare for retirement, protect assets, and plan estates, then earns fees tied largely to the amount of client money it oversees and the advice services it delivers.
The business is centered on recurring wealth management income rather than one-off product sales. Based on the company’s reporting structure and business model, its main revenue drivers can be summarized as follows:
- Wealth management and ongoing advice fees: approximately 70% to 80% of underlying business income. This includes charges linked to funds under management and ongoing servicing of client accounts.
- Investment management-related income: approximately 10% to 20%. This covers elements tied to the management of client portfolios and in-house or affiliated investment solutions.
- Protection, retirement, and other product-related income: approximately 5% to 15%. This includes financial planning activity around pensions, insurance, and related client solutions.
That mix matters because it makes St. James’s Place more sensitive to client asset levels, market movements, and net inflows than to traditional lending activity. It is not a bank, so the key engine is adviser-led distribution plus long-duration client relationships. The broader financial flow also shows how volatile accounting revenue can look from year to year in this sector, while underlying operating profit and cash generation often give a clearer picture of business momentum.
The company’s reported revenue and cost lines have been unusually volatile across recent years, reflecting the accounting complexity of investment-related businesses. More useful for long-term readers is the direction of operating profit and cash generation, which improved materially after the weaker 2022–2023 period.
Key Figures
| Metric | Value | Sector ⓘ |
|---|---|---|
| Date | Oct 24, 2026 | |
| Context | ||
| Sector | Financial Services | |
| Industry | Asset Management | |
| Market Cap ⓘ | $6.90B | |
| Beta ⓘ | 1.02 | |
Value (Cheapness) | ||
| P/E Ratio ⓘ | 9.79 | 12.46 |
| P/B Ratio ⓘ | 4.73 | 1.25 |
| FCF Yield ⓘ | 13.63% | 9.82% |
| Dividend Yield ⓘ | 1.29% | 2.94% |
| EBIT / EV ⓘ | N/A | 8.11% |
| PEG ⓘ | 1.68 | |
Growth (Business expansion) | ||
| Revenue Growth ⓘ | 213.00% | 9.10% |
| RPS Growth (5Y CAGR) ⓘ | -77.25% | 12.31% |
| EPS Growth (5Y CAGR) ⓘ | 4.46% | -6.97% |
| BVPS Growth (5Y CAGR) ⓘ | -0.10% | 5.02% |
| Margin Growth (5Y Trend) ⓘ | 2126.32% | -4.00% |
| FCF Growth (5Y CAGR) ⓘ | -6.71% | 4.71% |
| DPS Growth (5Y CAGR) ⓘ | -31.51% | 8.92% |
Quality (Business durability) | ||
| ROIC (Latest) ⓘ | N/A | 9.18% |
| ROE (Latest) ⓘ | 76.03% | 13.93% |
| ROA (Latest) ⓘ | 0.49% | 1.57% |
| ROIC (5Y Median) ⓘ | 27.26% | 7.80% |
| ROE (5Y Median) ⓘ | 34.05% | 12.15% |
| ROA (5Y Median) ⓘ | 0.22% | 1.28% |
| Net Debt / EBIT (Latest) ⓘ | 0.04 | 1.02 |
| Net Debt / EBIT (5Y Median) ⓘ | 0.19 | 0.72 |
| Net Debt / EBITDA (Latest) ⓘ | 0.03 | 0.88 |
| Operating Margin (Latest) ⓘ | 4.50% | 22.30% |
| Operating Margin (5Y Median) ⓘ | 4.20% | 24.50% |
| Debt to Equity (Latest) ⓘ | 33.04% | 59.34% |
| Profit Margin (Latest) ⓘ | 1.26% | 26.42% |
| Free Cash Flow (Latest) ⓘ | $939.79M | |
Momentum (Price trend) | ||
| 3Y Return ⓘ | +88.25% | +95.73% |
| 12M Return (excl. last month) ⓘ | -14.58% | +17.30% |
| 6M Return ⓘ | -19.63% | +6.07% |
| Price vs. 200-Day MA ⓘ | +15.67% | +5.36% |
St. James’s Place is a mid-to-large-sized listed wealth manager with share-price volatility close to the broader market. The table points to a mixed profile: valuation looks inexpensive on earnings but expensive on book value, quality is supported by very low leverage and strong returns on equity, while profitability margins remain below many financial peers. Growth indicators are uneven, with recent revenue growth and margin improvement standing out more positively than longer-term revenue-per-share, free cash flow, or dividend trends.
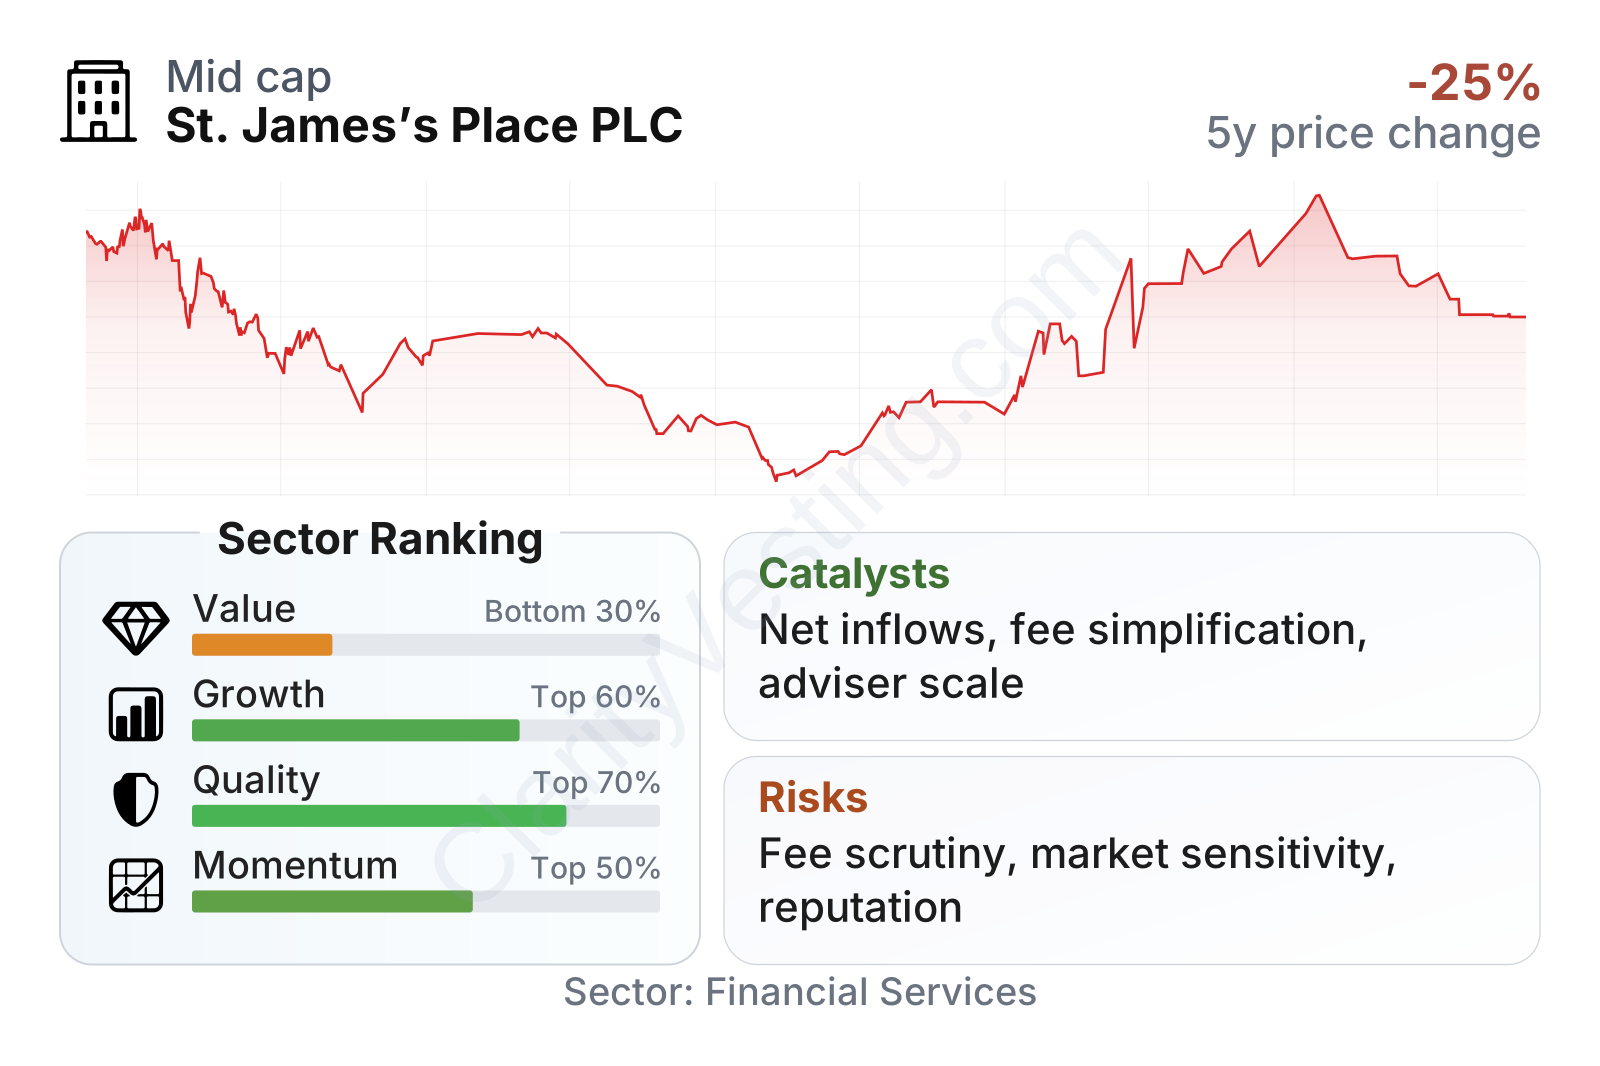
The stock’s path has also been eventful. After a steep drop through 2022 to early 2024, the shares recovered strongly into 2026. That rebound suggests sentiment improved as operational pressure eased, but it also means the market has already repriced part of the recovery.
Growth
St. James’s Place operates in a part of financial services with favorable long-term demand drivers. Aging populations, pension complexity, and the shift from defined-benefit retirement schemes to self-directed retirement planning all support demand for advice-led wealth management. In the U.K., households continue to hold large pools of savings that need investment, tax planning, and retirement solutions. That creates a supportive backdrop for firms able to retain advisers and gather client assets consistently.
The company’s strategy is logically aligned with that trend. Its model combines a branded advice network, a broad planning offering, and recurring fees linked to assets under management. This can scale well when markets rise and net client inflows remain positive. A key catalyst is any improvement in gross and net inflows, because new client money adds recurring fee potential and strengthens future earnings visibility. Another important catalyst is the ongoing simplification of the charging structure and product offering, which can help rebuild trust, reduce complexity, and improve competitiveness.
Recent company updates have pointed to resilience in adviser recruitment and retention, continued client engagement, and progress in adapting to the U.K. regulator’s focus on customer outcomes and fair value. If those efforts translate into steadier net inflows, they could support earnings growth without requiring a major expansion in balance-sheet risk.
Earnings per share have remained positive in the latest periods, which is important after earlier pressure on reported results. The bigger question is not whether the business can generate profit in a normal market, but whether it can convert its large advice network and client base into durable, less controversial growth.
Book value per share has moved unevenly rather than steadily upward. For a wealth manager, that is less critical than it would be for a lender, but it does show that balance-sheet growth has not been a simple straight line. Future expansion depends more on adviser productivity, net inflows, market levels, and pricing discipline than on heavy capital deployment.
Risks
This article is for informational purposes only and does not constitute financial advice. Some content is AI-generated. See Disclaimer


