Stock Analysis · SRH Total Return Fund Inc (STEW)
Overview
SRH Total Return Fund Inc. is a closed-end investment fund rather than an operating company with factories, stores, or software products. Its goal is to produce total return over time, which means a mix of capital appreciation and cash distributions. The fund is managed with a relatively concentrated portfolio and can invest across public equities, fixed-income securities, and private investments. In practice, the portfolio has had a strong tilt toward publicly traded U.S. stocks, with a meaningful but smaller allocation to private holdings and some cash or other investments depending on market conditions.
Because this is a fund, its economic engine is different from a normal business. Reported revenue and earnings mostly come from investment gains, dividend income, and interest income generated by the securities it owns, minus operating expenses and financing costs. That also means results can swing sharply from year to year depending on market performance and valuation changes inside the portfolio.
The most important sources behind the fund’s results are generally:
- Unrealized and realized gains on investments: typically the largest driver of annual results when equity markets are strong; this includes mark-to-market changes and profits from sales of portfolio holdings.
- Dividend income from equity holdings: recurring cash income from stocks owned by the fund.
- Interest income and other investment income: income from debt securities, cash balances, and other instruments when applicable.
- Private investment valuation changes: an important swing factor because a portion of the portfolio is not made up of continuously traded public securities.
Unlike an asset manager that earns fees from clients, SRH Total Return Fund does not primarily generate revenue by selling services. Shareholders are effectively exposed to the performance of the underlying portfolio and to the gap between the share price and the fund’s net asset value.
The financial flow over the last several years shows a useful pattern: reported revenue has been far more stable than net income, while bottom-line results have been extremely volatile. That is consistent with an investment fund whose accounting can be heavily influenced by gains and losses on holdings. Expenses and leverage appear relatively contained, but earnings are not steady in the way they would be for a traditional operating business.
Key Figures
| Metric | Value | Sector ⓘ |
|---|---|---|
| Date | Oct 17, 2026 | |
| Context | ||
| Sector | Financial Services | |
| Industry | Asset Management | |
| Market Cap ⓘ | $1.73B | |
| Beta ⓘ | 0.81 | |
Value (Cheapness) | ||
| P/E Ratio ⓘ | 11.93 | 12.26 |
| P/B Ratio ⓘ | 0.80 | 1.23 |
| FCF Yield ⓘ | 2.01% | 10.40% |
| Dividend Yield ⓘ | 4.13% | 3.02% |
| EBIT / EV ⓘ | N/A | 8.14% |
| PEG ⓘ | N/A | |
Growth (Business expansion) | ||
| Revenue Growth ⓘ | 3.50% | 9.35% |
| RPS Growth (5Y CAGR) ⓘ | -21.70% | 12.19% |
| EPS Growth (5Y CAGR) ⓘ | N/A | -9.53% |
| BVPS Growth (5Y CAGR) ⓘ | 10.30% | 4.99% |
| Margin Growth (5Y Trend) ⓘ | N/A | -3.86% |
| FCF Growth (5Y CAGR) ⓘ | -47.91% | 4.81% |
| DPS Growth (5Y CAGR) ⓘ | 12.89% | 8.79% |
Quality (Business durability) | ||
| ROIC (Latest) ⓘ | N/A | 9.49% |
| ROE (Latest) ⓘ | 21.84% | 13.90% |
| ROA (Latest) ⓘ | 19.65% | 1.55% |
| ROIC (5Y Median) ⓘ | N/A | 7.86% |
| ROE (5Y Median) ⓘ | 8.83% | 12.17% |
| ROA (5Y Median) ⓘ | 7.73% | 1.30% |
| Net Debt / EBIT (Latest) ⓘ | N/A | 0.96 |
| Net Debt / EBIT (5Y Median) ⓘ | N/A | 0.73 |
| Net Debt / EBITDA (Latest) ⓘ | 0.45 | 0.92 |
| Operating Margin (Latest) ⓘ | N/A | 22.30% |
| Operating Margin (5Y Median) ⓘ | N/A | 24.63% |
| Debt to Equity (Latest) ⓘ | 10.39% | 58.56% |
| Profit Margin (Latest) ⓘ | 446.83% | 26.57% |
| Free Cash Flow (Latest) ⓘ | $34.63M | |
Momentum (Price trend) | ||
| 3Y Return ⓘ | +53.82% | +88.33% |
| 12M Return (excl. last month) ⓘ | +4.19% | +19.38% |
| 6M Return ⓘ | +2.60% | +4.75% |
| Price vs. 200-Day MA ⓘ | +0.95% | +3.50% |
SRH Total Return Fund is a mid-sized closed-end fund with a market value around $1.7 billion and a beta below 1, which suggests lower share-price sensitivity than the broader equity market. On valuation metrics, the shares trade at a price-to-book ratio below 0.8 versus a sector median above 1.2, which indicates the market is valuing the fund at a discount to its underlying net assets. The dividend yield is also above the sector median, at a little over 4%.
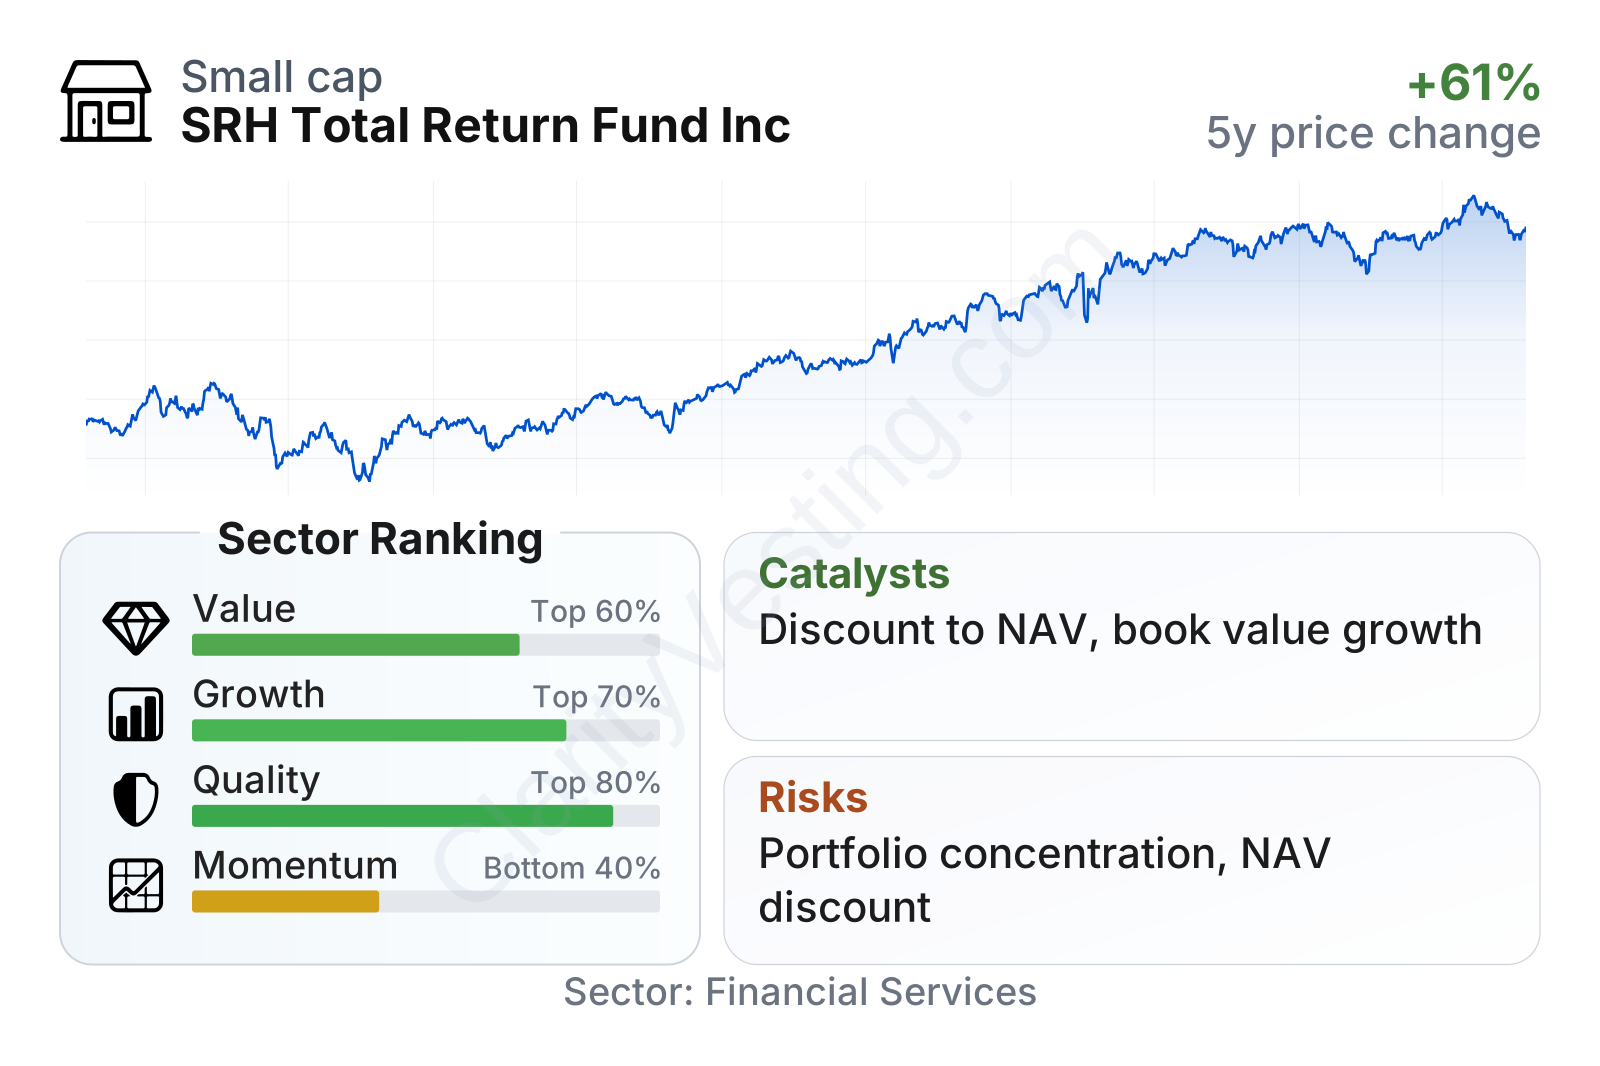
Quality indicators are strong on the surface. Return on equity is around 22% and return on assets is near 20%, both above sector norms, while debt-to-equity is only about 10%, far below the sector median near 60%. The balance sheet therefore looks conservative relative to many peers. Growth measures are more mixed: recent year-over-year revenue growth is positive but modest, long-term revenue per share has contracted, and free cash flow growth over five years has been weak. Share-price momentum has also lagged much of the financial sector even though the longer-term stock chart has still moved upward from 2022 levels.
Growth
For long-term analysis, the relevant growth question is less about industry expansion and more about whether the fund can compound net asset value per share, maintain distributions, and allocate capital well. Closed-end funds remain a durable part of public markets because they offer access to curated portfolios and, in some cases, less liquid investments that are harder to own directly. That gives SRH Total Return Fund a niche rather than participation in a high-growth industry in the usual sense.
Its strategy can make sense for future growth if management continues to build value through disciplined stock selection and selective private investments. A notable positive sign is book value per share growth. Over the last five years, book value per share has compounded at roughly 10%, which is clearly above the sector median. Since the fund’s net asset value is central to long-term wealth creation here, that trend matters more than short-term accounting revenue.
Earnings per share, however, are less dependable as a growth signal. The recent numbers show a meaningful drop from the unusually strong prior year, which highlights how sensitive results are to market gains and valuation marks. For this kind of vehicle, one strong or weak year does not always say much about the lasting earning power of the portfolio.
A possible catalyst is the persistent discount to book value. If portfolio performance stays solid, a discount can narrow over time through market recognition, corporate actions, or continued distributions. Another supportive factor is the fund’s dividend profile: dividend per share growth over five years has been stronger than the sector median, which may help keep attention on the shares as long as portfolio cash generation remains adequate.
Recent performance trends also show that the stock price has appreciated materially since late 2022. That suggests the market has acknowledged some of the improvement in underlying value, even if the shares still trade below book value. In addition, the fund’s low leverage leaves room for resilience if markets become more volatile, which can be important for preserving long-term compounding.
Risks
This article is for informational purposes only and does not constitute financial advice. Some content is AI-generated. See Disclaimer


