Stock Analysis · Stepstone Group Inc (STEP)
Overview
StepStone Group Inc is a global private markets investment firm. In simple terms, it helps large institutions, financial advisors, and wealthy clients invest in assets that are not usually traded on public stock exchanges. These investments include private equity, private debt, infrastructure, real estate, and venture capital. The company operates as both an advisor and an asset manager: it builds portfolios for clients, selects outside fund managers, co-invests directly in deals, and also runs its own investment products.
Its business model is built around assets under management and assets under advisement. As clients commit more capital, StepStone can earn recurring fees for managing or advising on those assets. It can also earn performance-based income when underlying investments do well, but that part is less predictable and can swing sharply from year to year.
Based on recent company filings, StepStone’s revenue is mainly split between fee-related earnings tied to managing or advising client assets and more volatile investment-related income. The exact mix can move materially depending on market conditions and the timing of investment realizations, but the core economic drivers can be summarized as follows:
- Management and advisory fees: approximately 55% to 70% of revenue in more normalized periods. This includes recurring fees earned for overseeing private market portfolios and customized investment programs for institutions and private wealth channels.
- Performance fees and carried interest: approximately 15% to 30% when realizations are active. This income comes from successful investment exits and portfolio gains, so it can be very strong in some years and much lower in weaker markets.
- Investment income and other revenues: approximately 10% to 20%. This includes income from StepStone’s own balance sheet investments and other related activities, which can introduce additional earnings volatility.
One of the most important points for long-term readers is that StepStone sits in a part of finance that has been attracting capital for years: private markets. Rather than competing as a traditional mutual fund manager, it is positioned in a more specialized area where clients often want broad manager access, research depth, and portfolio construction expertise.
The overall earnings flow has become much more volatile in recent years. Revenue has grown strongly at times, but operating costs and investment-related swings have also increased, which explains why reported profit has not followed a smooth upward path.
Key Figures
| Metric | Value | Sector ⓘ |
|---|---|---|
| Date | Oct 03, 2026 | |
| Context | ||
| Sector | Financial Services | |
| Industry | Asset Management | |
| Market Cap ⓘ | $5.60B | |
| Beta ⓘ | 1.28 | |
Value (Cheapness) | ||
| P/E Ratio ⓘ | N/A | 12.60 |
| P/B Ratio ⓘ | N/A | 1.23 |
| FCF Yield ⓘ | -7.84% | 10.16% |
| Dividend Yield ⓘ | 2.60% | 2.96% |
| EBIT / EV ⓘ | -23.03% | 7.77% |
| PEG ⓘ | N/A | |
Growth (Business expansion) | ||
| Revenue Growth ⓘ | 4.00% | 9.50% |
| RPS Growth (5Y CAGR) ⓘ | -0.64% | 12.10% |
| EPS Growth (5Y CAGR) ⓘ | -23.92% | -9.45% |
| BVPS Growth (5Y CAGR) ⓘ | N/A | 5.01% |
| Margin Growth (5Y Trend) ⓘ | -83.66% | -4.07% |
| FCF Growth (5Y CAGR) ⓘ | -25.93% | 4.96% |
| DPS Growth (5Y CAGR) ⓘ | 34.71% | 8.79% |
Quality (Business durability) | ||
| ROIC (Latest) ⓘ | -201.70% | 9.60% |
| ROE (Latest) ⓘ | N/A | 13.84% |
| ROA (Latest) ⓘ | -9.36% | 1.53% |
| ROIC (5Y Median) ⓘ | -3.32% | 7.86% |
| ROE (5Y Median) ⓘ | 21.81% | 12.20% |
| ROA (5Y Median) ⓘ | -0.48% | 1.29% |
| Net Debt / EBIT (Latest) ⓘ | N/A | 0.91 |
| Net Debt / EBIT (5Y Median) ⓘ | N/A | 0.74 |
| Net Debt / EBITDA (Latest) ⓘ | N/A | 0.97 |
| Operating Margin (Latest) ⓘ | -52.42% | 22.12% |
| Operating Margin (5Y Median) ⓘ | 28.77% | 24.39% |
| Debt to Equity (Latest) ⓘ | -290.80% | 60.37% |
| Profit Margin (Latest) ⓘ | -30.54% | 26.62% |
| Free Cash Flow (Latest) ⓘ | -$439.39M | |
Momentum (Price trend) | ||
| 3Y Return ⓘ | +59.53% | +89.23% |
| 12M Return (excl. last month) ⓘ | -17.02% | +17.35% |
| 6M Return ⓘ | -2.40% | +10.00% |
| Price vs. 200-Day MA ⓘ | -12.19% | +3.73% |
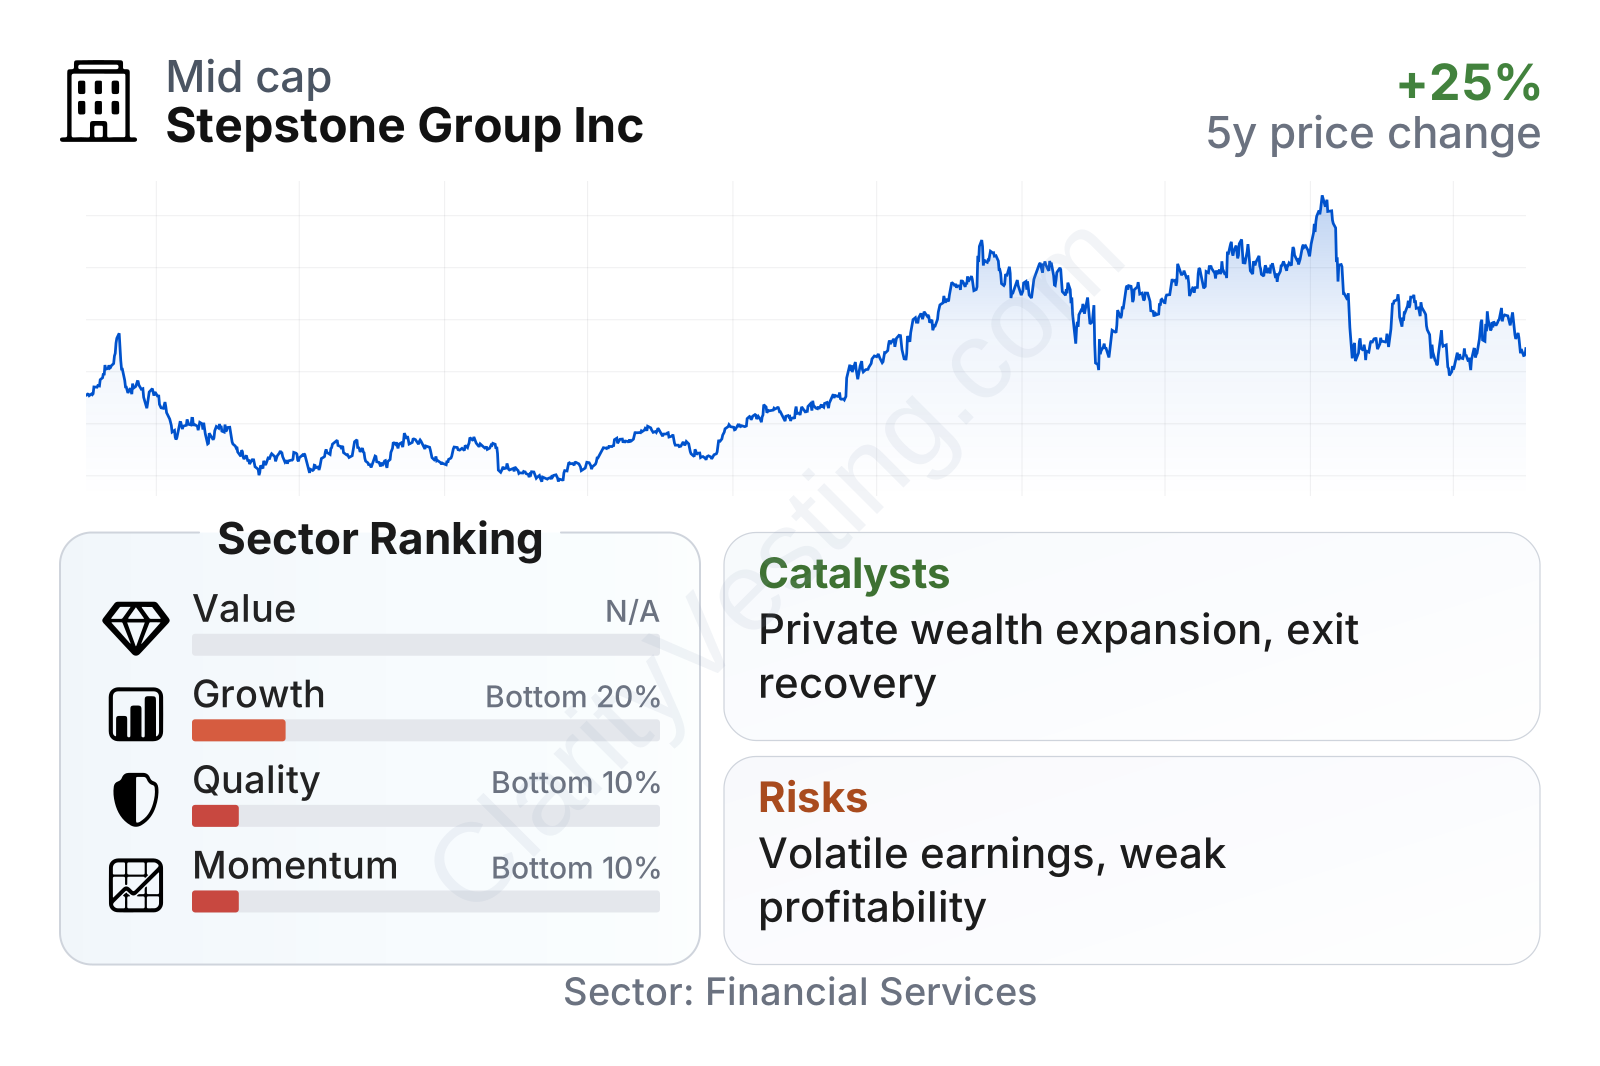
StepStone is a mid-sized publicly traded asset manager, with a market capitalization of roughly $5.6 billion and a beta above 1, meaning the stock has tended to move more sharply than the broader market. The factor profile shown in the table is weak in the aggregate: growth ranks in the bottom 20% of the sector, while quality and momentum rank in the bottom 10%. Revenue growth is still positive, but slower than the sector median, and profitability metrics have recently turned negative. Dividend yield is close to the sector norm, yet free cash flow and earnings-based value measures currently look much weaker than most peers.
The stock price history also highlights a business that the market re-rates aggressively. Shares rebounded strongly through 2024 and early 2026, then gave back a meaningful part of that gain. That pattern fits StepStone’s underlying economics: recurring fees provide some support, but sentiment can change quickly when performance income, realizations, or margins weaken.
Growth
StepStone operates in a sector with a favorable long-term backdrop. Institutional investors have steadily increased allocations to private equity, private credit, infrastructure, and real assets in search of diversification and returns that differ from public markets. A second leg of growth is the expansion of private market access into wealth management channels, where financial advisors and affluent individuals are gaining more ways to invest in these strategies. That trend could enlarge StepStone’s addressable market well beyond its traditional institutional client base.
The company’s strategy broadly makes sense for that environment. It combines advisory, fund investing, separately managed accounts, co-investments, and increasingly private wealth offerings. This gives StepStone multiple ways to capture client demand rather than relying on a single product. Its broad platform across asset classes can also help clients consolidate relationships with one manager that can build diversified private market portfolios.
A notable catalyst is the continued expansion of the private wealth channel. StepStone has been investing in products and distribution aimed at advisors and individual investors, a market that remains much less penetrated than the institutional segment. If that effort scales well, it could produce more stable fee growth and reduce reliance on sporadic realization-driven income.
Another favorable driver is the recovery of dealmaking and exits in private markets. When transaction activity improves, StepStone can benefit in several ways at once: new client commitments may rise, deployment can accelerate, and performance-related revenues have more opportunities to be recognized. In other words, a better private markets cycle does not just help one line item; it can support several parts of the model.
Earnings per share show that underlying earnings power can recover when markets are supportive. The longer trend is uneven rather than consistently compounding, but the rebound in annual EPS through fiscal 2026 suggests the franchise can generate solid results in stronger environments. That said, the more recent quarterly level is much lower, reinforcing that growth is not linear.
Book value per share is a weaker signal here. The progression into negative territory reflects accounting and balance-sheet complexity that makes this metric less comforting than it would be for a more traditional asset manager. For long-term analysis, this raises the importance of fee-related earnings growth and asset gathering over simple balance-sheet expansion.
Recent company communications have also pointed to continued product launches, fundraising activity, and international platform development. None of these alone guarantees a step-change in earnings, but together they support the idea that StepStone is still building into a larger private markets ecosystem rather than merely defending an existing niche.
Risks
This article is for informational purposes only and does not constitute financial advice. Some content is AI-generated. See Disclaimer


