Stock Analysis · S&T Bancorp Inc (STBA)
Overview
S&T Bancorp is a regional bank headquartered in Pennsylvania. Through S&T Bank, it provides everyday banking services to individuals, businesses, and government customers. Its activities include taking deposits, making loans, offering cash management and treasury services, wealth management, and insurance-related services. Like many regional banks, it is mainly a spread business: it earns money from the difference between what it receives on loans and securities and what it pays on deposits and borrowings.
The company’s revenue mix is led by net interest income, with the remainder coming from fees and service businesses. Based on recent annual reporting, the approximate revenue structure is:
- Net interest income after provision for credit losses: about 79% to 82%. This is the core banking business, largely tied to commercial real estate, commercial and industrial loans, residential real estate, consumer lending, and the investment portfolio.
- Wealth management and trust fees: about 6% to 8%. This includes trust, investment advisory, retirement planning, and related asset-based fees.
- Service charges and debit-card related fees: about 4% to 6%. These come from deposit account fees, interchange income, and payment activity.
- Mortgage banking, insurance, and other noninterest income: about 6% to 9%. This includes mortgage-related fees, bank-owned life insurance income, and a mix of smaller fee categories.
S&T is not a national banking giant; it is a small regional lender with a focused footprint. That matters because its performance depends heavily on local economic conditions, loan quality, and disciplined deposit pricing rather than on broad national scale.
The revenue bridge over recent years shows a business that expanded meaningfully from 2021 to 2025, but with pressure from rising interest expense as deposit costs moved up. Revenue has held near record levels, while earnings have been steadier than spectacular because funding costs absorbed part of that growth.
Key Figures
| Metric | Value | Sector ⓘ |
|---|---|---|
| Date | Oct 03, 2026 | |
| Context | ||
| Sector | Financial Services | |
| Industry | Banks - Regional | |
| Market Cap ⓘ | $1.71B | |
| Beta ⓘ | 0.83 | |
Value (Cheapness) | ||
| P/E Ratio ⓘ | 12.97 | 12.60 |
| P/B Ratio ⓘ | 1.28 | 1.23 |
| FCF Yield ⓘ | 8.66% | 10.16% |
| Dividend Yield ⓘ | 1.48% | 2.96% |
| EBIT / EV ⓘ | N/A | 7.77% |
| PEG ⓘ | 1.23 | |
Growth (Business expansion) | ||
| Revenue Growth ⓘ | 6.10% | 9.50% |
| RPS Growth (5Y CAGR) ⓘ | 12.98% | 12.10% |
| EPS Growth (5Y CAGR) ⓘ | -14.07% | -9.45% |
| BVPS Growth (5Y CAGR) ⓘ | 5.33% | 5.01% |
| Margin Growth (5Y Trend) ⓘ | -8.79% | -4.07% |
| FCF Growth (5Y CAGR) ⓘ | -11.76% | 4.96% |
| DPS Growth (5Y CAGR) ⓘ | 4.89% | 8.79% |
Quality (Business durability) | ||
| ROIC (Latest) ⓘ | N/A | 9.60% |
| ROE (Latest) ⓘ | 9.77% | 13.84% |
| ROA (Latest) ⓘ | 1.42% | 1.53% |
| ROIC (5Y Median) ⓘ | 13.01% | 7.86% |
| ROE (5Y Median) ⓘ | 9.86% | 12.20% |
| ROA (5Y Median) ⓘ | 1.37% | 1.29% |
| Net Debt / EBIT (Latest) ⓘ | N/A | 0.91 |
| Net Debt / EBIT (5Y Median) ⓘ | 0.88 | 0.74 |
| Net Debt / EBITDA (Latest) ⓘ | 0.36 | 0.97 |
| Operating Margin (Latest) ⓘ | N/A | 22.12% |
| Operating Margin (5Y Median) ⓘ | 33.39% | 24.39% |
| Debt to Equity (Latest) ⓘ | 19.61% | 60.37% |
| Profit Margin (Latest) ⓘ | 34.75% | 26.62% |
| Free Cash Flow (Latest) ⓘ | $147.73M | |
Momentum (Price trend) | ||
| 3Y Return ⓘ | +102.66% | +89.23% |
| 12M Return (excl. last month) ⓘ | +28.74% | +17.35% |
| 6M Return ⓘ | +17.76% | +10.00% |
| Price vs. 200-Day MA ⓘ | +8.96% | +3.73% |
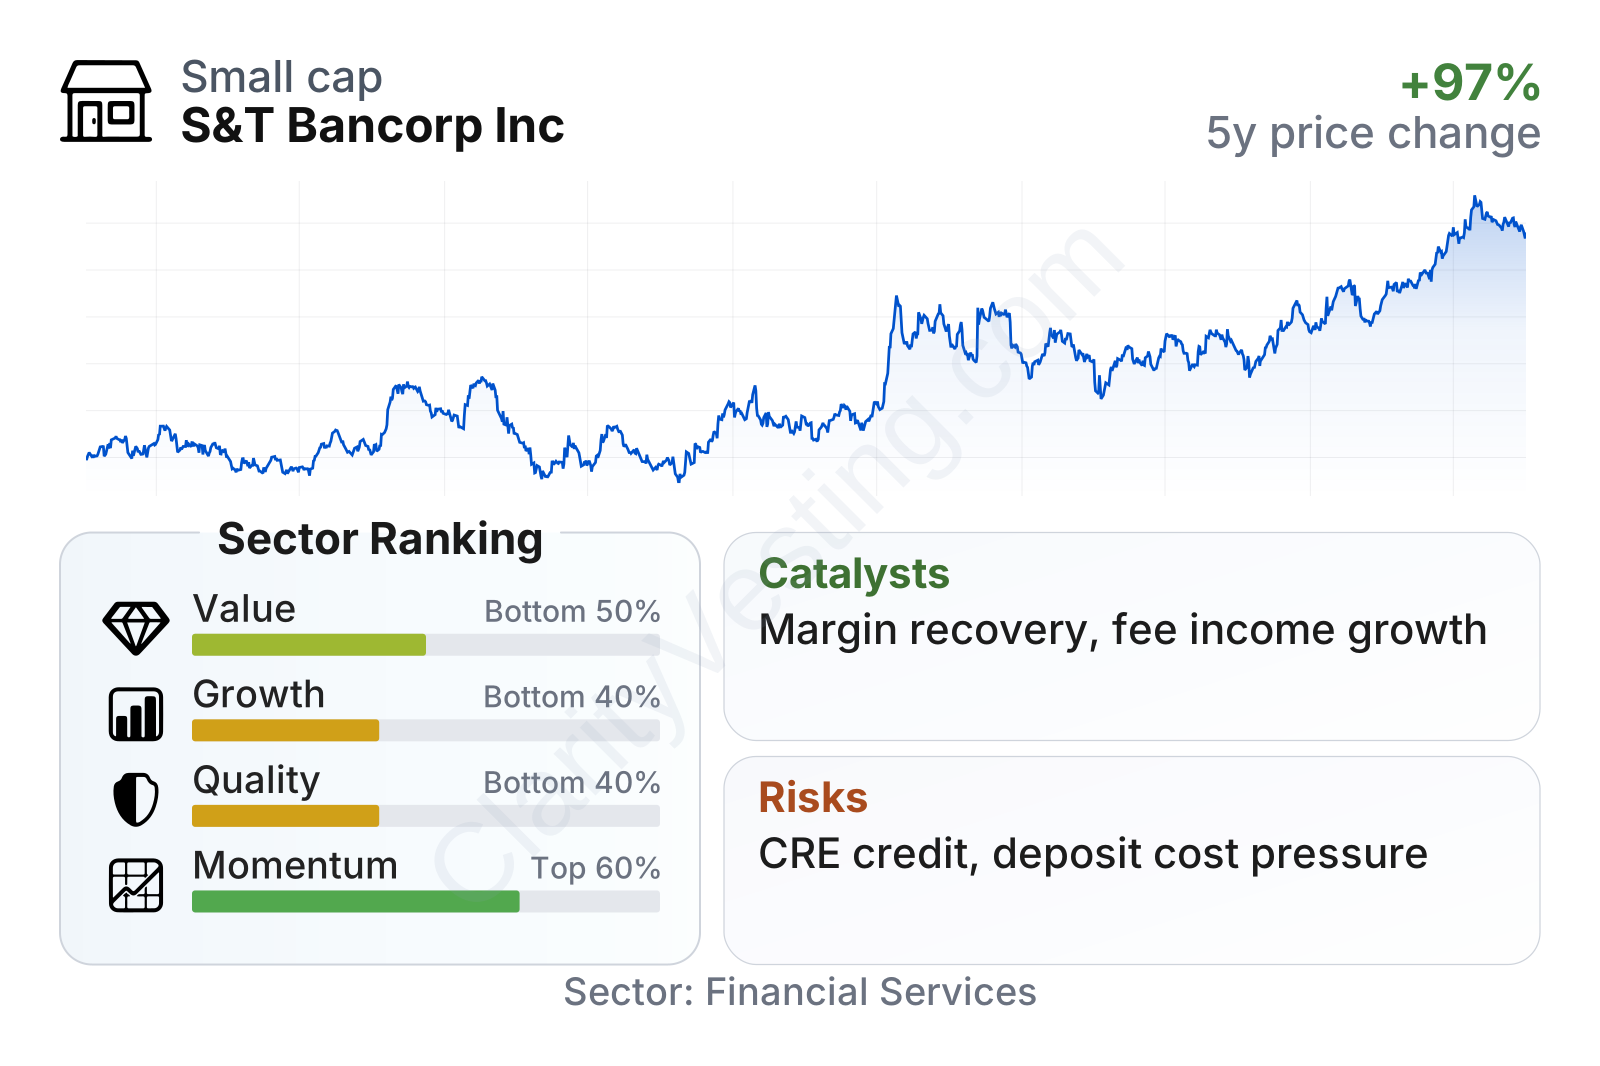
S&T Bancorp is a mid-sized regional bank with a relatively calm trading profile, reflected in a beta below 1. The stock has shown stronger recent momentum than the sector median, but the factor table points to a more mixed fundamental picture. Value metrics sit close to sector norms rather than clearly below them, while quality and growth rank in the lower part of the peer group. That combination suggests the market has recently rewarded the shares more for improving sentiment around regional banks than for clearly superior operating performance.
Profitability is still respectable. Return measures remain healthy in absolute terms, profit margin is above the sector median, and balance-sheet leverage appears conservative with debt-to-equity well below the sector median. At the same time, recent revenue growth has trailed the sector median, dividend yield is lower than many bank peers, and long-term earnings growth has been uneven.
Growth
Regional banking is a mature sector, so growth usually comes from a few specific levers: expanding loans, gathering lower-cost deposits, adding fee businesses, improving efficiency, and making disciplined acquisitions. S&T’s strategy broadly fits that pattern. The company has emphasized relationship banking in its Pennsylvania and surrounding markets, with a meaningful presence in commercial lending and a useful mix of fee-generating businesses such as wealth management.
A practical reason the bank still has room to grow is market share. In regional banking, a smaller institution can expand by winning business from local competitors, especially if it has strong community ties and good underwriting discipline. The company’s five-year revenue per share growth has been a little better than the sector median, which suggests it has been able to expand the business base even though profit growth has not followed as cleanly.
Earnings per share climbed from 2021 through 2023, then softened in 2024 before stabilizing again. That pattern is consistent with the pressure many banks faced when deposit costs rose faster than loan yields. For long-term analysis, the key point is less about one weak year and more about whether the bank can rebuild earnings through a better funding mix, loan repricing, and steady credit performance.
Book value per share has moved upward over the last several years, which is an encouraging sign for a bank because book value is closely tied to capital strength and retained earnings. The growth rate is roughly in line with the sector median, indicating that S&T has continued to build shareholder equity even during a more difficult rate environment.
The main near-term catalyst is the interest-rate cycle. If deposit costs stabilize or ease while loan yields remain supportive, net interest margin can improve without requiring aggressive balance-sheet growth. A second catalyst is fee income: wealth management and other noninterest businesses can help reduce dependence on spread income. A third is normal regional bank consolidation. Well-run smaller banks can benefit either by acquiring selectively or by becoming more efficient in markets where weaker competitors pull back.
Recent company communications have also highlighted loan and deposit discipline, capital strength, and continued investment in customer-facing capabilities. Those are not explosive growth drivers, but they are the kind that tend to matter over a full cycle for a regional bank.
Risks
This article is for informational purposes only and does not constitute financial advice. Some content is AI-generated. See Disclaimer


