Stock Analysis · STAAR Surgical Company (STAA)
Overview
STAAR Surgical Company designs and sells implantable lenses used in eye surgery, with a strong focus on refractive procedures that reduce dependence on glasses or contact lenses. Its best-known products are EVO Implantable Collamer Lenses, or ICLs, which are placed inside the eye to correct myopia and, in some cases, astigmatism. The company operates in ophthalmology, a medical field supported by long-term demand drivers such as rising rates of nearsightedness, growing interest in premium vision correction, and increasing healthcare access in parts of Asia.
Unlike diversified medical device groups, STAAR is highly concentrated around one product family. That makes the business easy to understand, but it also means operating results depend heavily on procedure trends, surgeon adoption, regulatory progress, and execution in a relatively narrow category.
The company’s revenue mix is primarily organized by geography in public filings, while product concentration is also clear from management disclosures.
- Implantable lenses and related sales: the large majority of revenue, centered on EVO/EVO+ Visian ICL products and related ophthalmic offerings. In recent years, this has represented well above 90% of company sales.
- Asia-Pacific: historically the largest regional contributor, often around 70% to 80% of revenue, with China and Japan especially important because of high myopia prevalence and established surgeon demand.
- EMEA: generally the second-largest region, often contributing around 10% to 15% of revenue.
- Americas: typically the smallest major region, often around 10% to 15% of revenue, but strategically important because the U.S. market can influence long-term scale and brand visibility.
Financially, the business had expanded strongly through 2023, with revenue rising from about $230 million in 2021 to more than $320 million in 2023. That momentum then reversed sharply in 2024 and 2025 as sales weakened and operating losses appeared. The pattern is important: this is not a mature steady earner, but a specialized growth company trying to regain operating discipline after a difficult reset.
The long-term pattern shows an attractive gross profit structure, but also a clear deterioration in operating efficiency. Revenue and gross profit climbed meaningfully through 2023, then fell in 2024 and 2025 while selling, general, and administrative spending remained elevated. That gap explains why profits moved from solidly positive to significantly negative.
Key Figures
| Metric | Value | Sector ⓘ |
|---|---|---|
| Date | Oct 17, 2026 | |
| Context | ||
| Sector | Healthcare | |
| Industry | Medical Instruments & Supplies | |
| Market Cap ⓘ | $1.10B | |
| Beta ⓘ | 1.18 | |
Value (Cheapness) | ||
| P/E Ratio ⓘ | 273.00 | 24.79 |
| P/B Ratio ⓘ | 3.14 | 3.08 |
| FCF Yield ⓘ | -0.62% | 3.15% |
| Dividend Yield ⓘ | N/A | 1.94% |
| EBIT / EV ⓘ | 1.91% | 0.57% |
| PEG ⓘ | 0.76 | |
Growth (Business expansion) | ||
| Revenue Growth ⓘ | 111.00% | 7.45% |
| RPS Growth (5Y CAGR) ⓘ | 0.90% | 8.61% |
| EPS Growth (5Y CAGR) ⓘ | -22.47% | -17.81% |
| BVPS Growth (5Y CAGR) ⓘ | 7.35% | 3.72% |
| Margin Growth (5Y Trend) ⓘ | -47.96% | -0.62% |
| FCF Growth (5Y CAGR) ⓘ | N/A | 1.04% |
| DPS Growth (5Y CAGR) ⓘ | N/A | 6.77% |
Quality (Business durability) | ||
| ROIC (Latest) ⓘ | 2.46% | 3.24% |
| ROA (Latest) ⓘ | 0.82% | 3.01% |
| ROIC (5Y Median) ⓘ | 5.83% | 4.60% |
| ROA (5Y Median) ⓘ | 4.70% | 1.89% |
| Net Debt / EBIT (Latest) ⓘ | -4.89 | 1.34 |
| Net Debt / EBIT (5Y Median) ⓘ | -4.37 | 1.84 |
| Net Debt / EBITDA (Latest) ⓘ | -3.40 | 1.00 |
| Net Debt / Assets ⓘ | -23.70% | 5.45% |
| EBITDA / Interest ⓘ | N/A | 9.64 |
| Operating Margin (Latest) ⓘ | 6.78% | 9.27% |
| Operating Margin (5Y Median) ⓘ | 10.45% | 7.38% |
| Debt to Equity (Latest) ⓘ | 9.84% | 28.58% |
| Profit Margin (Latest) ⓘ | 1.13% | 3.59% |
| Free Cash Flow (Latest) ⓘ | -$6.75M | |
Momentum (Price trend) | ||
| 3Y Return ⓘ | -48.04% | +42.80% |
| 12M Return (excl. last month) ⓘ | -18.87% | +18.50% |
| 6M Return ⓘ | -9.99% | +7.57% |
| Price vs. 200-Day MA ⓘ | -5.57% | +5.12% |
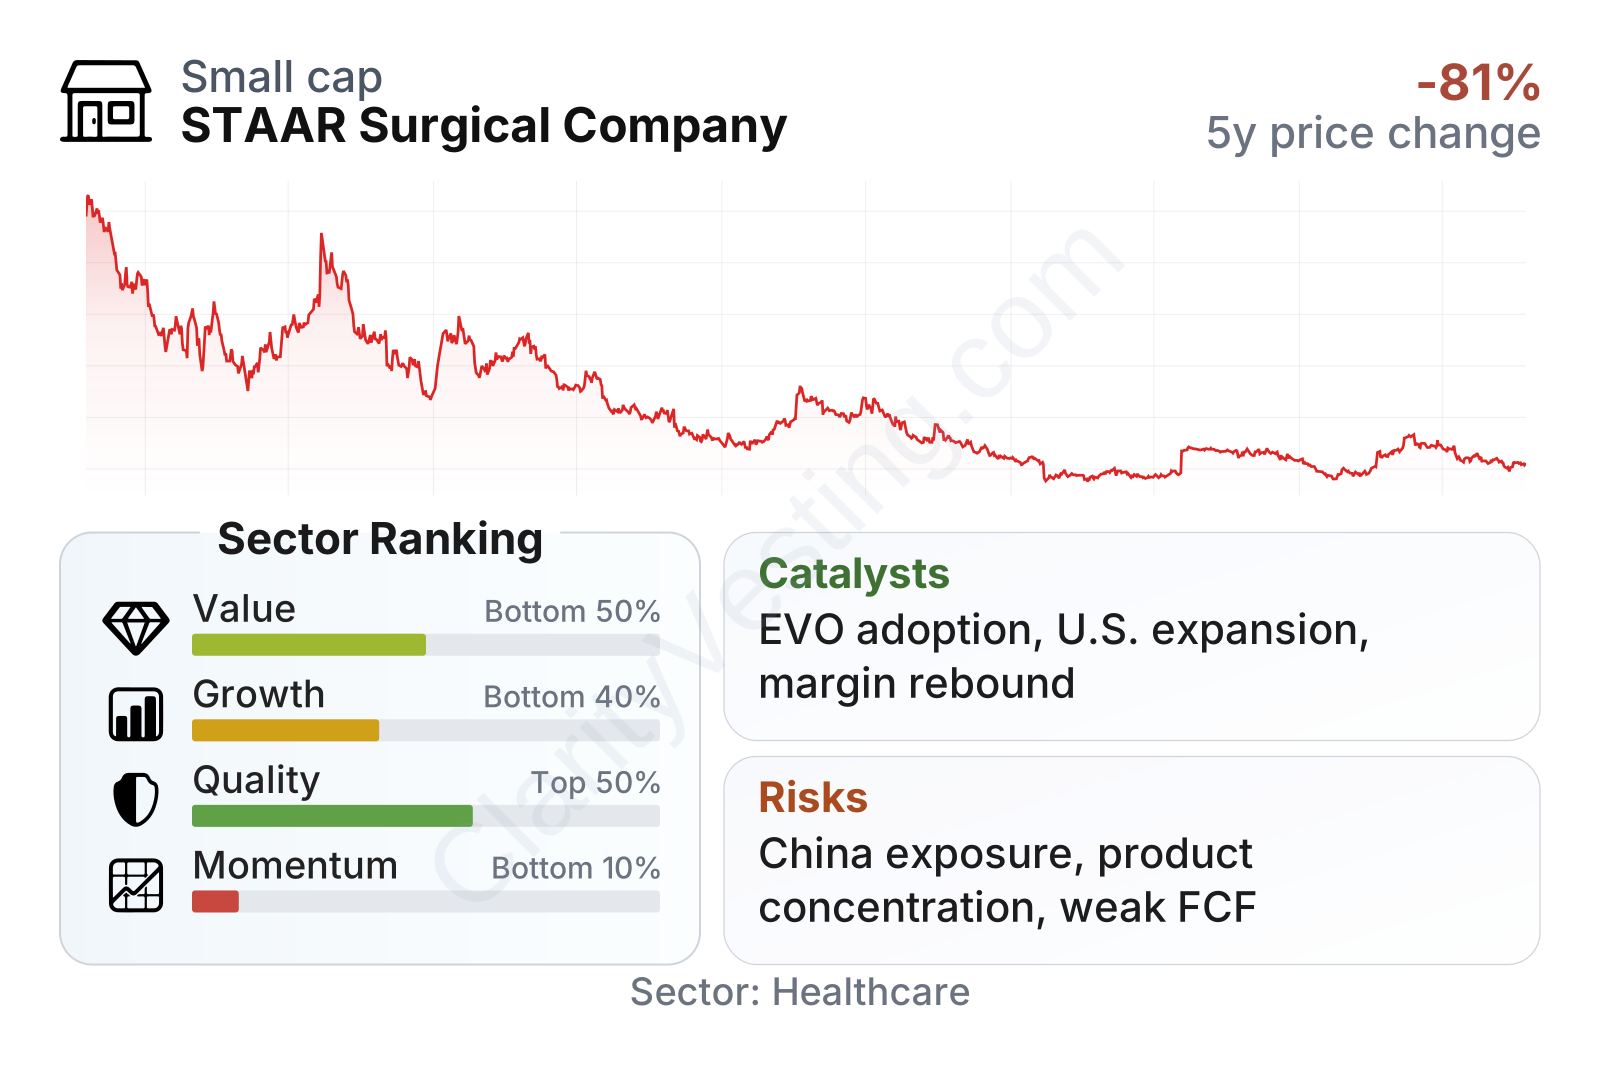
STAAR is currently a mid-sized medical technology company with a stock that has been much more volatile than the broader market. The quality profile is helped by a very clean balance sheet, including low leverage and net cash, but that strength is offset by weak recent profitability and a growth ranking that remains below much of the healthcare sector over a multi-year view. Momentum is still soft despite some recent share-price recovery, reflecting how much confidence was lost during the downturn.
The stock price history captures that reset clearly. Shares were above $100 in 2021, then declined sharply over the following years before stabilizing in the mid-to-high $20s in 2026. That move suggests the market has already repriced the company from a high-expectation growth name to a more uncertain turnaround case.
Growth
STAAR operates in a part of eye care with real structural potential. Myopia is growing globally, especially in Asia, and premium vision correction remains appealing because it is elective, personalized, and often paid for outside traditional reimbursement channels. Implantable lenses also occupy a useful position between glasses or contacts and corneal laser procedures, particularly for patients with higher prescriptions or those who are not ideal LASIK candidates.
The company’s strategy still makes sense on paper. It is centered on expanding surgeon adoption of EVO lenses, increasing procedure volume in established markets, broadening clinical use cases, and deepening penetration in newer regions. This is a focused commercial model rather than a broad product-platform strategy. If execution improves, that focus can be powerful because one successful lens franchise can scale globally.
The revenue trend has been unusually volatile. Growth was strong for several years, then turned sharply negative in late 2024 and the first half of 2025, before rebounding dramatically in 2026. Recent year-over-year growth above 100% looks impressive, but it should be read in context: it comes after a depressed comparison base. The key question is not just whether growth has returned, but whether the recovery is durable and can translate into stable earnings.
Cash generation remains the weaker part of the recovery. Free cash flow was positive earlier in the cycle, then swung deeply negative as the downturn intensified. That means growth alone is not enough; STAAR also needs tighter cost control and better conversion of sales into cash. Even so, the company’s balance sheet gives it more room than many small healthcare peers to work through this phase.
A meaningful catalyst is continued adoption of EVO ICL in large myopia markets where awareness, surgeon training, and consumer acceptance can all improve over time. Another catalyst is any evidence that the U.S. business can become a more significant contributor, because success there could improve both volume and market perception. Recent company communications have also emphasized operational refocusing and commercial initiatives, which matter because the company does not need a new identity as much as it needs cleaner execution.
Risks
This article is for informational purposes only and does not constitute financial advice. Some content is AI-generated. See Disclaimer


