Stock Analysis · Shurgard Self Storage S.A (SSSAF)
Overview
Shurgard Self Storage S.A. is a European self-storage operator. It owns, develops, and runs storage facilities for individuals and businesses that need extra space for household goods, seasonal items, moving transitions, inventory, archives, or small business equipment. The company is especially active in large urban areas where housing is smaller, mobility is high, and available real estate is expensive.
Its business model is relatively simple. Shurgard rents storage units on short-term contracts, usually month to month, which gives it pricing flexibility and allows it to adjust rates more quickly than many other property businesses. Revenue is supported by a large base of recurring rental payments, while the underlying assets are physical properties in supply-constrained metropolitan markets.
The company’s revenue is overwhelmingly centered on self-storage operations. Based on recent annual reporting and company disclosures, the mix can be summarized approximately as follows:
- Storage rental income: about 90% to 95% — monthly rent paid by customers for storage units across the company’s network.
- Ancillary storage-related income: about 5% to 10% — insurance commissions, sale of packing materials, administration fees, and other customer services tied to occupancy.
- Other revenue: limited — minor items not central to the operating model.
Geographically, Shurgard is concentrated in Western Europe, with major exposure to countries such as France, the Netherlands, Sweden, Germany, Belgium, the United Kingdom, and Denmark. This gives it diversification across markets, but the business is still tightly linked to the health of European cities and consumer demand for flexible space.
The financial profile reflects a property company with high operating profitability and strong cash generation. Revenue has trended upward over the last several years, and gross profit has expanded with it. At the same time, earnings can move sharply because property revaluations, taxes, and financing costs can materially affect reported net income from year to year.
The long-term pattern shows a business that has increased revenue meaningfully since 2021 while keeping direct operating costs well under control. Reported earnings are more volatile than revenue, which is common in listed real estate companies because non-cash valuation effects and tax items can create large swings.
Key Figures
| Metric | Value | Sector ⓘ |
|---|---|---|
| Date | Oct 17, 2026 | |
| Context | ||
| Sector | Real Estate | |
| Industry | REIT - Specialty | |
| Market Cap ⓘ | $2.52B | |
| Beta ⓘ | 0.81 | |
Value (Cheapness) | ||
| P/E Ratio ⓘ | 6.94 | 17.38 |
| P/B Ratio ⓘ | 0.58 | 0.85 |
| FCF Yield ⓘ | 14.35% | 7.38% |
| Dividend Yield ⓘ | 4.62% | 4.85% |
| EBIT / EV ⓘ | N/A | 3.78% |
| PEG ⓘ | N/A | |
Growth (Business expansion) | ||
| Revenue Growth ⓘ | 3.20% | 5.30% |
| RPS Growth (5Y CAGR) ⓘ | 3.58% | 6.02% |
| EPS Growth (5Y CAGR) ⓘ | -23.30% | -11.37% |
| BVPS Growth (5Y CAGR) ⓘ | 8.57% | 0.45% |
| Margin Growth (5Y Trend) ⓘ | -42.72% | -0.22% |
| FCF Growth (5Y CAGR) ⓘ | 22.36% | 5.40% |
| DPS Growth (5Y CAGR) ⓘ | -29.55% | 5.02% |
Quality (Business durability) | ||
| ROIC (Latest) ⓘ | N/A | 5.69% |
| ROE (Latest) ⓘ | 19.68% | 7.56% |
| ROA (Latest) ⓘ | N/A | 2.85% |
| ROIC (5Y Median) ⓘ | 13.31% | 4.22% |
| ROE (5Y Median) ⓘ | 16.51% | 6.03% |
| ROA (5Y Median) ⓘ | 10.65% | 2.44% |
| Net Debt / EBIT (Latest) ⓘ | N/A | 7.59 |
| Net Debt / EBIT (5Y Median) ⓘ | 1.66 | 8.40 |
| Net Debt / EBITDA (Latest) ⓘ | N/A | 5.27 |
| Net Debt / Assets ⓘ | 23.10% | 37.76% |
| EBITDA / Interest ⓘ | N/A | 4.10 |
| Operating Margin (Latest) ⓘ | N/A | 35.29% |
| Operating Margin (5Y Median) ⓘ | 171.92% | 37.31% |
| Debt to Equity (Latest) ⓘ | 39.35% | 88.87% |
| Profit Margin (Latest) ⓘ | 68.36% | 19.61% |
| Free Cash Flow (Latest) ⓘ | $362.28M | |
Momentum (Price trend) | ||
| 3Y Return ⓘ | -35.75% | +30.75% |
| 12M Return (excl. last month) ⓘ | -28.34% | +4.36% |
| 6M Return ⓘ | -13.76% | -2.52% |
| Price vs. 200-Day MA ⓘ | -11.25% | -2.34% |
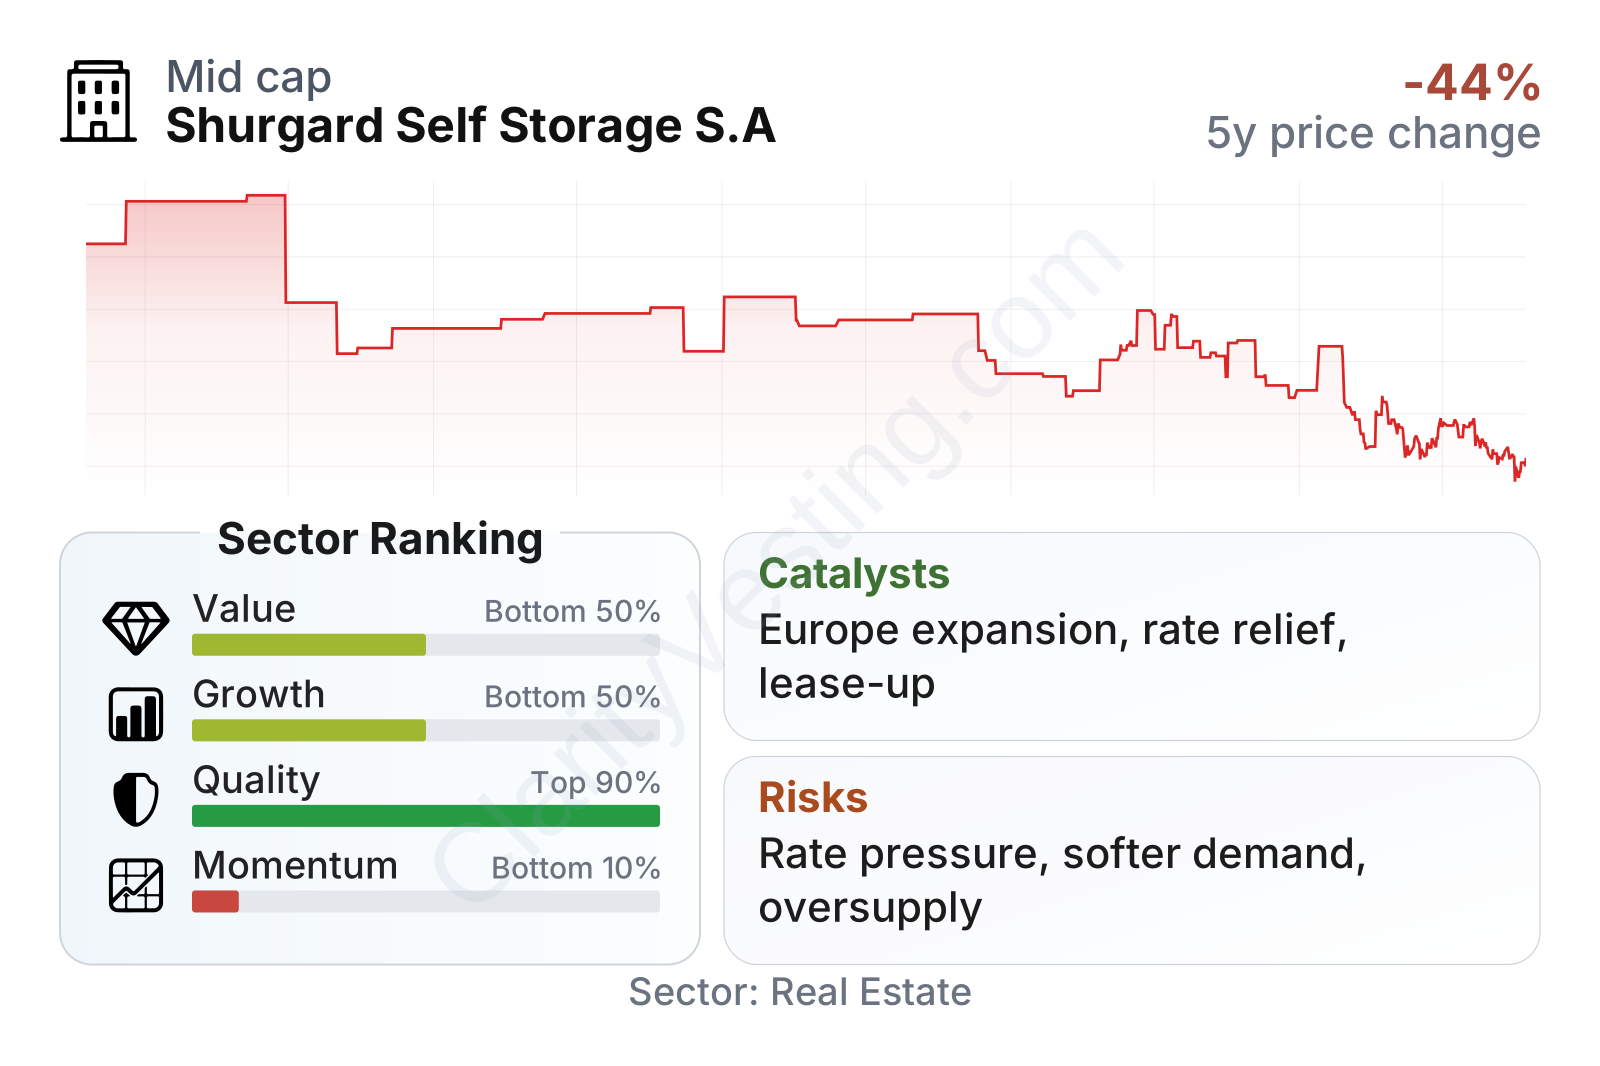
Shurgard stands out for quality rather than market momentum. Profitability and balance-sheet metrics look stronger than much of the real estate sector, with high returns on capital and lower leverage than many peers. Free cash flow generation also appears solid. On the other hand, growth metrics are less impressive, recent share-price performance has been weak, and the value picture is mixed: earnings and cash flow multiples look low, while the company’s broader factor ranking is pulled down by slower operating growth.
The share price history shows a stock that has lost ground from earlier highs and has struggled over the last one to three years. That weakness likely reflects a combination of higher interest rates, pressure on real estate valuations, and softer sentiment toward property companies rather than a collapse in the operating business itself.
Growth
Self-storage remains a structurally attractive niche within real estate. Demand is supported by urbanization, smaller living spaces, life events such as moving and divorce, and the growing use of storage by small businesses. In Europe, the sector is still less mature than in the United States, which leaves room for additional store openings, acquisitions, and higher customer awareness over time.
Shurgard’s strategy fits that backdrop well. The company focuses on dense urban markets where land is scarce and replacement competition is harder to build. Scale matters in self-storage because a large network improves brand visibility, online marketing efficiency, pricing analytics, and customer convenience across a city or region. That is one reason leading operators can often outperform smaller local competitors.
Another useful feature is the short duration of customer contracts. Unlike offices or logistics properties tied to long leases, self-storage operators can reprice space relatively quickly. That helps protect revenue during inflationary periods, although it can also expose demand if rent increases become too aggressive.
Revenue per share improved steadily from 2021 through 2024 before pulling back in 2025. That suggests the core business had been expanding on a per-share basis, but recent growth has become less consistent. For long-term analysis, that makes new capacity delivery, occupancy trends, and same-store pricing particularly important to watch.
One clear catalyst is continued expansion in underpenetrated European cities. Shurgard has regularly communicated development activity and selective acquisitions as part of its growth model. New stores usually take time to mature, but once stabilized they can add recurring rental income on top of the existing portfolio.
A second catalyst is operating leverage. Once a facility reaches higher occupancy, a large part of incremental rent can flow through to profit because staffing and many site costs do not rise at the same pace as revenue. This can make modest demand growth more valuable than it first appears.
The dividend trend has been weaker than revenue trends, with a notable decline in recent years. That does not automatically signal business deterioration, because listed property companies often adjust distributions due to capital allocation, regulatory structure, or timing of asset activity. Still, it indicates that income growth has not been the main attraction recently; asset quality and cash generation appear more central to the case.
As for recent opportunity, the broader real estate selloff has created a setting in which companies with durable assets, manageable leverage, and solid cash flow can look more attractive if financing conditions stabilize. For Shurgard specifically, any easing in interest-rate pressure, combined with continued rent growth and lease-up of new stores, could materially improve sentiment.
Risks
This article is for informational purposes only and does not constitute financial advice. Some content is AI-generated. See Disclaimer


