Stock Analysis · SSP Group PLC (SSPPF)
Overview
SSP Group PLC is a travel food and beverage operator. In simple terms, it runs restaurants, coffee shops, bars, and convenience-style food outlets in places where people are in transit: airports, train stations, and selected roadside locations. The group operates both its own brands and well-known licensed brands, which lets it serve travelers through a broad mix of quick-service meals, coffee, snacks, and casual dining.
The business model is built around high-traffic travel hubs. That gives SSP exposure to passenger volumes rather than traditional downtown restaurant footfall. Its customers are mainly airport and rail travelers, and the company earns revenue from food and beverage sales at concession locations it operates under contracts with transport hub owners.
Based on recent annual reporting, revenue is primarily split by region rather than by brand category, and the largest sources are approximately:
- North America: about 39% of revenue. This includes airport dining and travel-hub food outlets in the United States and Canada.
- Continental Europe: about 33% of revenue. This covers operations in countries such as Spain, France, Germany, and other European travel markets.
- UK & Ireland: about 17% of revenue. This includes rail stations and airports, with a meaningful presence in the UK travel network.
- APAC and EEME: about 11% of revenue. This includes Asia-Pacific and parts of Eastern Europe and the Middle East.
Operationally, the more important split is by channel. Airports are the dominant part of the group, ahead of rail, while other channels such as motorway services are much smaller. That matters because airport traffic tends to offer stronger spending per customer, but it also makes the company more sensitive to air travel trends.
Over the last few years, revenue has recovered strongly from the disruption caused by the pandemic, and the business has rebuilt operating profit. However, net profit remains more volatile because interest costs and financing obligations still absorb a meaningful part of earnings.
The progression in recent years shows a clear revenue rebound and a much stronger operating result than in 2022. Even so, the gap between operating profit and net income shows that financing costs remain an important drag on shareholder earnings.
Key Figures
| Metric | Value | Sector ⓘ |
|---|---|---|
| Date | Oct 03, 2026 | |
| Context | ||
| Sector | Consumer Cyclical | |
| Industry | Restaurants | |
| Market Cap ⓘ | $1.91B | |
| Beta ⓘ | 0.91 | |
Value (Cheapness) | ||
| P/E Ratio ⓘ | N/A | 17.04 |
| P/B Ratio ⓘ | 313.52 | 1.61 |
| FCF Yield ⓘ | 39.70% | 9.02% |
| Dividend Yield ⓘ | 1.73% | 2.75% |
| EBIT / EV ⓘ | N/A | 6.69% |
| PEG ⓘ | N/A | |
Growth (Business expansion) | ||
| Revenue Growth ⓘ | 6.20% | 5.60% |
| RPS Growth (5Y CAGR) ⓘ | 39.57% | 9.04% |
| EPS Growth (5Y CAGR) ⓘ | N/A | -17.44% |
| BVPS Growth (5Y CAGR) ⓘ | -26.16% | 5.73% |
| Margin Growth (5Y Trend) ⓘ | 47.61% | -0.26% |
| FCF Growth (5Y CAGR) ⓘ | 110.06% | 4.91% |
| DPS Growth (5Y CAGR) ⓘ | -26.40% | 10.48% |
Quality (Business durability) | ||
| ROIC (Latest) ⓘ | 23.70% | 12.38% |
| ROA (Latest) ⓘ | -0.67% | 5.54% |
| ROIC (5Y Median) ⓘ | 8.70% | 10.63% |
| ROA (5Y Median) ⓘ | -0.34% | 5.44% |
| Net Debt / EBIT (Latest) ⓘ | 4.35 | 2.16 |
| Net Debt / EBIT (5Y Median) ⓘ | 7.18 | 2.31 |
| Net Debt / EBITDA (Latest) ⓘ | 1.66 | 1.52 |
| Net Debt / Assets ⓘ | 61.58% | 21.74% |
| EBITDA / Interest ⓘ | 5.97 | 9.06 |
| Operating Margin (Latest) ⓘ | 7.44% | 9.12% |
| Operating Margin (5Y Median) ⓘ | 6.64% | 9.56% |
| Debt to Equity (Latest) ⓘ | 36503.13% | 76.18% |
| Profit Margin (Latest) ⓘ | -0.78% | 5.30% |
| Free Cash Flow (Latest) ⓘ | $758.97M | |
Momentum (Price trend) | ||
| 3Y Return ⓘ | +2.83% | +11.77% |
| 12M Return (excl. last month) ⓘ | +22.02% | +0.61% |
| 6M Return ⓘ | +5.16% | +1.32% |
| Price vs. 200-Day MA ⓘ | -23.74% | -3.47% |
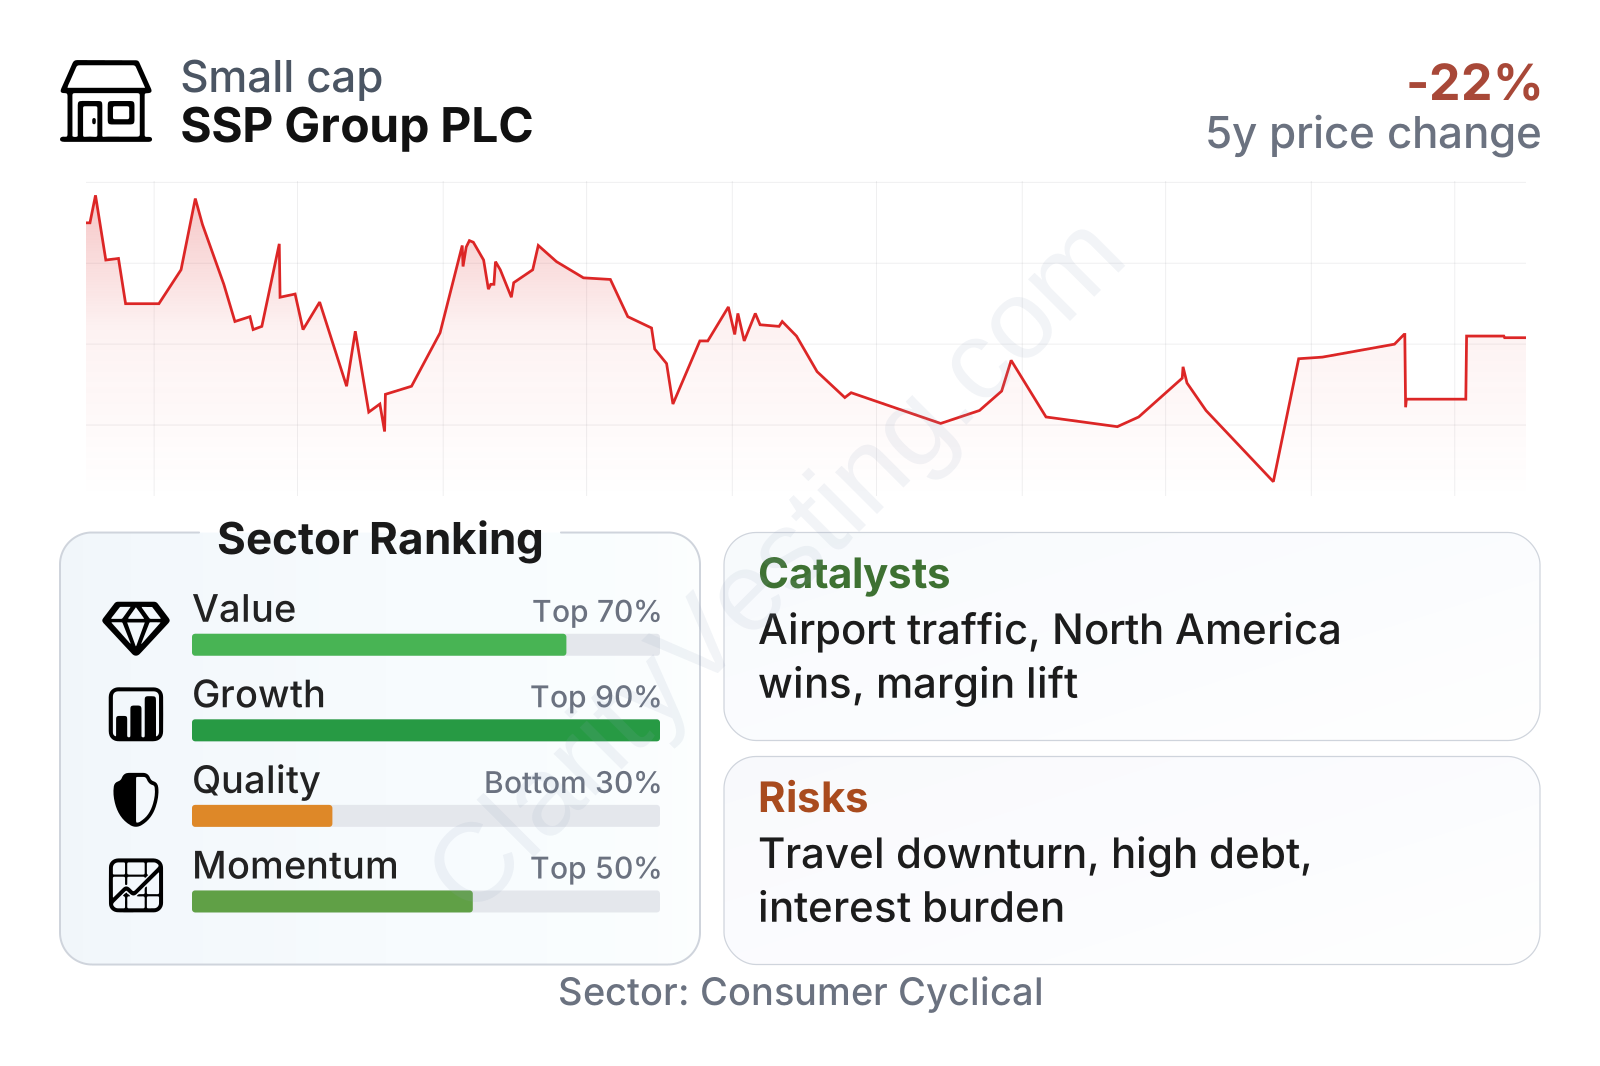
SSP is a mid-sized public company with a share price history that still reflects the long recovery from the travel shutdown period. The stock has risen over parts of the last year, but over a longer three-year view it has not kept pace with the broader restaurant peer group.
The metric profile is mixed. Growth indicators are strong relative to the sector, helped by the rebound in travel demand, improving margins, and a sharp recovery in cash generation. Value measures also look supportive in some areas, especially free cash flow yield and a low earnings multiple versus the sector median.
The weaker area is balance-sheet quality. Profitability at the net income level remains thin, leverage is elevated, and book-value-based measures are distorted by the company’s capital structure and low equity base. In practice, this means the business is producing meaningful cash, but that strength is partly offset by debt-related pressure.
Growth
SSP operates in a part of the restaurant industry that has a favorable long-term backdrop: travel-linked food service. Air passenger volumes and rail traffic tend to grow over time with tourism, business travel, urbanization, and rising mobility. Spending per passenger can also improve as operators refine menus, pricing, and site mix. This makes the sector structurally different from standard high-street restaurants, because location access and concession contracts create a more protected demand base.
The company’s strategy is broadly logical for future expansion. It focuses on winning and renewing concession contracts in travel hubs, expanding in North America and other large transport markets, and using a combination of owned and licensed brands to fit local demand. That model allows SSP to tailor concepts by location: premium coffee in one terminal, grab-and-go in another, and branded casual dining where dwell times are longer.
A notable support for the investment case is the company’s scale. SSP has a broad international footprint and long experience in running food operations in complex travel settings. Those capabilities can matter when bidding for large airport and rail contracts, where landlords want operators that can manage compliance, staffing, logistics, and multiple brand formats.
Recent company reporting has pointed to continued contract wins, net gains in units, and resilient like-for-like sales progress in key regions. North America remains especially important because it is both SSP’s largest revenue source and a market with room for further penetration. If passenger traffic continues to normalize and major hub operators keep upgrading retail and dining layouts, SSP has a credible path to additional growth.
Another catalyst is operating leverage. Once traffic volumes rise through existing locations, a portion of additional sales can convert into profit more efficiently than at the start of a recovery cycle. The recent improvement in operating margin suggests this mechanism is already at work, even if not all of it is yet reaching the bottom line.
Risks
This article is for informational purposes only and does not constitute financial advice. Some content is AI-generated. See Disclaimer


