Stock Analysis · SSE plc (SSEZF)
Overview
SSE plc is a large British utility group focused on electricity networks and low-carbon power. The company develops, owns, operates, and invests in assets that move electricity across the grid and generate power from renewable and flexible sources. Its footprint is mainly in the United Kingdom and Ireland, and its business model combines regulated network earnings with market-linked generation income.
In simple terms, SSE makes money from two broad activities. One is running critical electricity infrastructure, where returns are shaped by regulation. The other is producing and managing electricity, especially from wind and hydro assets, where earnings depend more on power output and market conditions. This mix gives SSE some stability from networks while also giving it exposure to long-term electrification and renewable build-out.
Based on the company’s segment reporting in recent annual materials, the main economic drivers can be summarized approximately as follows:
- Electricity Networks: about 45% to 55% of operating profit in a typical recent year. This includes transmission in northern Scotland and electricity distribution networks.
- Renewable Generation: about 25% to 35%. This mainly includes onshore wind, offshore wind, and hydro generation.
- Flexible Thermal and Energy Balancing: about 10% to 20%. This includes gas-fired generation, storage, and related system balancing activity.
- Other activities: generally a small share. This can include energy-related services, development activities, and corporate items.
Those percentages are best viewed as directional because utility reporting can move with regulation, weather, commodity prices, project timing, and portfolio changes. The broad takeaway is clear: SSE is primarily a networks-and-renewables company, not a retail supplier-driven utility.
The business flow over the last several years also shows a company with volatile reported revenue but more resilient underlying profitability. Sales moved sharply with energy market conditions, while gross profit and operating income recovered after a weak 2023 and then stayed at healthier levels in 2024 through 2026. Interest expense also eased versus earlier peaks, which matters for a capital-intensive utility.
Key Figures
| Metric | Value | Sector ⓘ |
|---|---|---|
| Date | Oct 17, 2026 | |
| Context | ||
| Sector | Utilities | |
| Industry | Utilities - Diversified | |
| Market Cap ⓘ | $40.56B | |
| Beta ⓘ | 0.56 | |
Value (Cheapness) | ||
| P/E Ratio ⓘ | 23.51 | 17.28 |
| P/B Ratio ⓘ | 3.37 | 1.51 |
| FCF Yield ⓘ | -2.28% | 0.65% |
| Dividend Yield ⓘ | 2.05% | 3.77% |
| EBIT / EV ⓘ | N/A | 5.01% |
| PEG ⓘ | 0.80 | |
Growth (Business expansion) | ||
| Revenue Growth ⓘ | -2.10% | 6.10% |
| RPS Growth (5Y CAGR) ⓘ | 1.99% | 3.87% |
| EPS Growth (5Y CAGR) ⓘ | 4.19% | -11.30% |
| BVPS Growth (5Y CAGR) ⓘ | 8.04% | 4.23% |
| Margin Growth (5Y Trend) ⓘ | -20.14% | 3.57% |
| FCF Growth (5Y CAGR) ⓘ | N/A | -8.84% |
| DPS Growth (5Y CAGR) ⓘ | 5.29% | 4.84% |
Quality (Business durability) | ||
| ROIC (Latest) ⓘ | 14.80% | 6.53% |
| ROA (Latest) ⓘ | 7.50% | 3.20% |
| ROIC (5Y Median) ⓘ | 7.44% | 5.95% |
| ROA (5Y Median) ⓘ | 4.06% | 2.75% |
| Net Debt / EBIT (Latest) ⓘ | 2.56 | 7.13 |
| Net Debt / EBIT (5Y Median) ⓘ | 4.38 | 7.23 |
| Net Debt / EBITDA (Latest) ⓘ | 1.76 | 4.31 |
| Net Debt / Assets ⓘ | 32.71% | 38.42% |
| EBITDA / Interest ⓘ | 15.78 | 4.58 |
| Operating Margin (Latest) ⓘ | 22.27% | 20.83% |
| Operating Margin (5Y Median) ⓘ | 21.42% | 20.08% |
| Debt to Equity (Latest) ⓘ | 103.50% | 137.69% |
| Profit Margin (Latest) ⓘ | 11.87% | 11.37% |
| Free Cash Flow (Latest) ⓘ | -$923.78M | |
Momentum (Price trend) | ||
| 3Y Return ⓘ | +93.10% | +52.37% |
| 12M Return (excl. last month) ⓘ | +45.07% | +8.84% |
| 6M Return ⓘ | -11.69% | -3.95% |
| Price vs. 200-Day MA ⓘ | +12.08% | -0.79% |
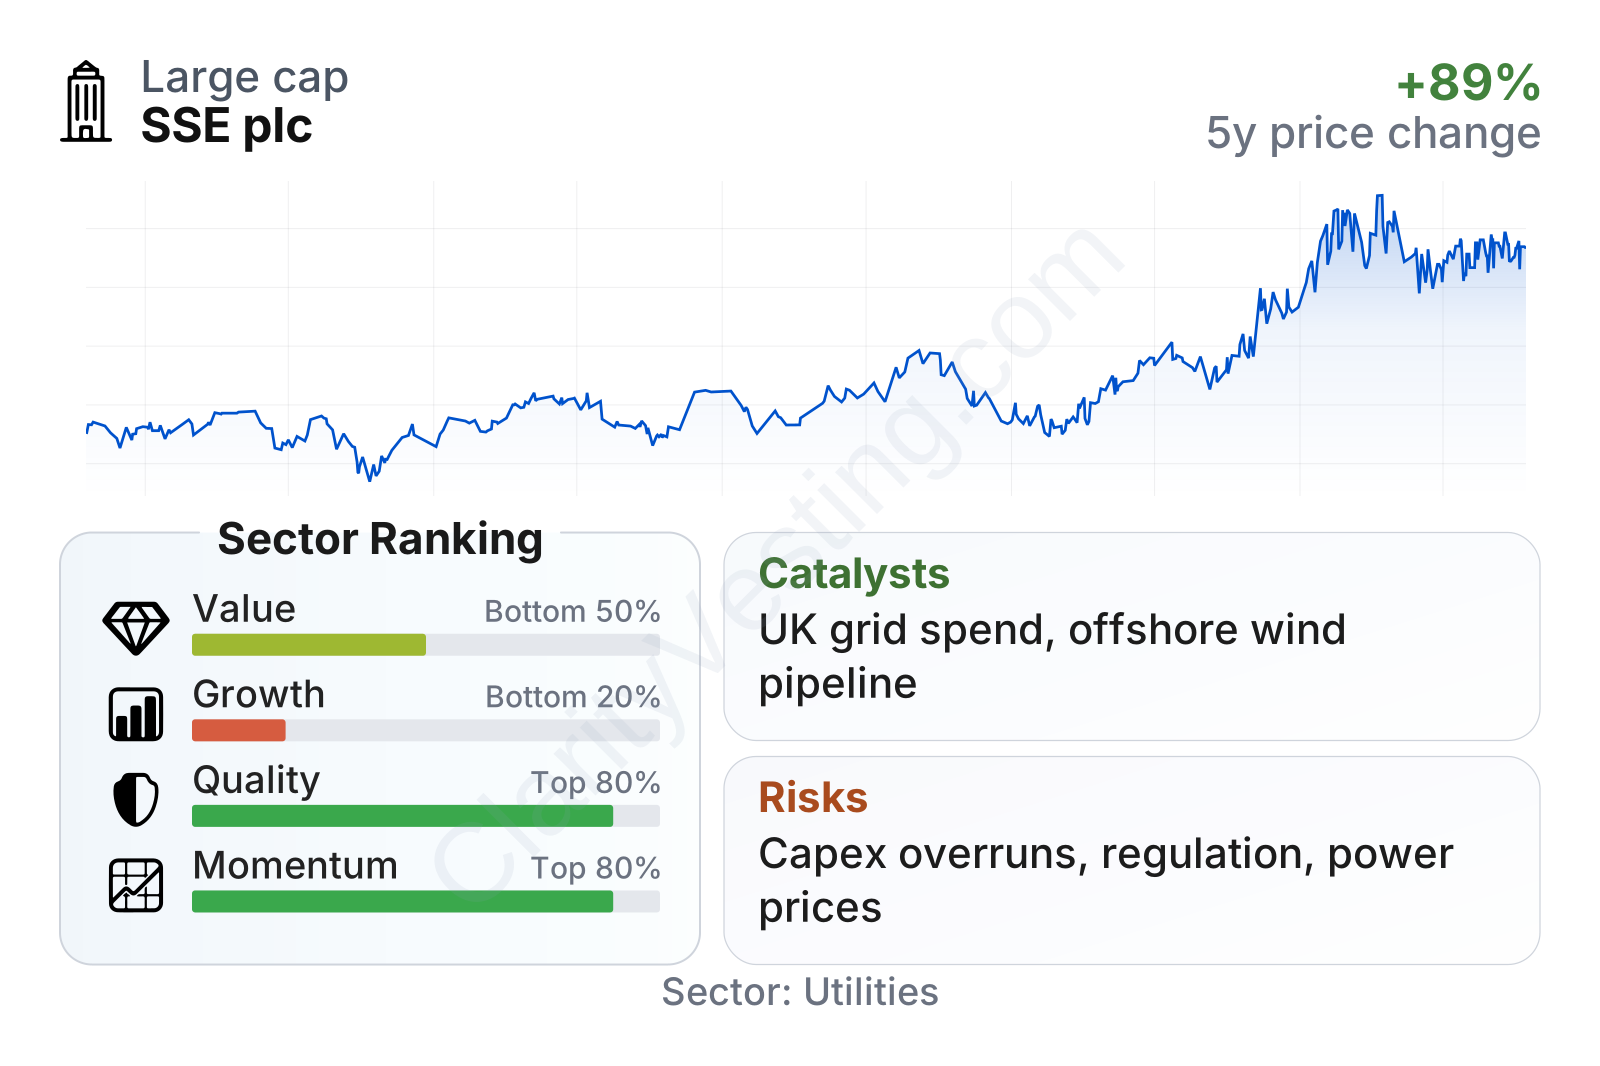
SSE is a very large utility with relatively low share-price volatility, as shown by a beta well below 1. Across the factor groups, the picture is mixed. Valuation metrics sit in the weaker half of the sector, growth ranks near the bottom of the peer set, but business quality and market momentum both compare favorably. Profitability and balance-sheet coverage look stronger than many utilities, while free cash flow remains a soft spot because of heavy ongoing investment.
The stock’s longer-term price trend has been strong, with performance over three years and over the last year excluding the most recent month running ahead of the sector median. That suggests the market has been giving more credit to SSE’s networks and renewable positioning than it did a few years ago.
Growth
SSE operates in a sector with durable structural support. Electricity grids need major expansion as economies electrify transport, heating, and industry. At the same time, governments in the UK and Europe continue to push for more renewable generation and grid reinforcement. That backdrop is favorable for companies that already own transmission assets and have a development pipeline in low-carbon power.
SSE’s strategy is coherent with that trend. The company has been concentrating capital on electricity networks and renewable infrastructure rather than on lower-growth legacy activities. For a long-term business assessment, that matters because regulated grid investment can create visible returns over long periods, while renewable development can add another layer of expansion when projects are delivered on time and on budget.
Revenue per share has not followed a straight upward line in recent years. It rose sharply in 2023 and then drifted lower through 2026, which reflects how utility revenue can be affected by commodity prices, output, and portfolio mix. That uneven top-line profile helps explain why SSE’s growth ranking is currently weak versus the sector, even though its earnings and asset base have been developing more constructively than revenue alone would suggest.
Free cash flow is the main area where growth needs careful interpretation. SSE is spending heavily on long-lived assets, so near-term cash generation can look weak or negative even when the company is building future earning power. That is common in utilities during major investment cycles, but it means progress is likely to show up first in regulated asset growth, project completions, and future earnings rather than in current free cash flow.
A notable catalyst is the company’s role in the UK grid expansion and offshore wind build-out. New transmission spending, rising network asset bases, and the commissioning of major renewable projects could support earnings visibility over several years. Recent company updates have also emphasized disciplined capital allocation and partnership structures for large projects, which can help fund expansion without relying entirely on the balance sheet.
Risks
This article is for informational purposes only and does not constitute financial advice. Some content is AI-generated. See Disclaimer


