Stock Analysis · Simpson Manufacturing Company Inc (SSD)
Overview
Simpson Manufacturing Company Inc. makes structural building products used to connect, reinforce, anchor, and protect wood and concrete construction. Through its Simpson Strong-Tie brand and related businesses, the company sells metal connectors, screws, anchors, fasteners, adhesives, coatings, and software or engineering solutions that help builders meet structural and safety requirements. Its products are commonly used in residential construction, remodeling, light commercial projects, and infrastructure-related applications.
The business is driven mainly by products tied to construction activity, especially in North America. Based on company disclosures, the revenue mix is best understood through geography and end-market exposure rather than a fully detailed product-by-product percentage split.
- North America: approximately 80% to 85% of revenue. This is the core business and includes the large U.S. installed base for structural connectors, anchors, screws, and fastening systems.
- Europe: approximately 10% to 15% of revenue. This includes structural connectors and fastening systems sold across several European markets.
- Asia-Pacific and other regions: approximately 3% to 7% of revenue. This is a smaller contribution but offers some diversification beyond the U.S. housing cycle.
By demand driver, the company is heavily exposed to residential construction and repair/remodel activity, with a smaller share tied to commercial and infrastructure uses. Its product range is broad, but the most important categories are structural connectors and fastening systems, followed by anchors, adhesives, and related engineered solutions. That mix matters because many of these parts are low-cost relative to the total price of a building project, yet they are mission-critical for code compliance and structural performance.
Over the last several years, the company has expanded revenue from about $1.6 billion in 2021 to more than $2.3 billion in 2025, while remaining highly profitable. The broad pattern visible in its cost structure is that sales growth has been accompanied by rising gross profit, with operating expenses increasing more gradually than revenue over the full period despite some margin pressure from inflation, integration costs, and a higher expense base.
Key Figures
| Metric | Value | Sector ⓘ |
|---|---|---|
| Date | Oct 17, 2026 | |
| Context | ||
| Sector | Basic Materials | |
| Industry | Lumber & Wood Production | |
| Market Cap ⓘ | $7.01B | |
| Beta ⓘ | 1.32 | |
Value (Cheapness) | ||
| P/E Ratio ⓘ | 18.70 | 16.90 |
| P/B Ratio ⓘ | 3.32 | 1.65 |
| FCF Yield ⓘ | 6.68% | 5.76% |
| Dividend Yield ⓘ | 0.68% | 2.13% |
| EBIT / EV ⓘ | 7.05% | 6.30% |
| PEG ⓘ | 3.80 | |
Growth (Business expansion) | ||
| Revenue Growth ⓘ | 6.30% | 11.10% |
| RPS Growth (5Y CAGR) ⓘ | 11.44% | 4.49% |
| EPS Growth (5Y CAGR) ⓘ | -10.99% | -13.47% |
| BVPS Growth (5Y CAGR) ⓘ | 15.55% | 5.51% |
| Margin Growth (5Y Trend) ⓘ | -3.02% | -1.54% |
| FCF Growth (5Y CAGR) ⓘ | 30.79% | 0.37% |
| DPS Growth (5Y CAGR) ⓘ | 4.42% | 6.08% |
Quality (Business durability) | ||
| ROIC (Latest) ⓘ | 15.60% | 9.26% |
| ROA (Latest) ⓘ | 12.25% | 4.91% |
| ROIC (5Y Median) ⓘ | 24.67% | 7.70% |
| ROA (5Y Median) ⓘ | 13.59% | 3.86% |
| Net Debt / EBIT (Latest) ⓘ | -0.05 | 1.40 |
| Net Debt / EBIT (5Y Median) ⓘ | 0.25 | 1.70 |
| Net Debt / EBITDA (Latest) ⓘ | -0.04 | 0.95 |
| Net Debt / Assets ⓘ | -0.85% | 13.69% |
| EBITDA / Interest ⓘ | N/A | 12.34 |
| Operating Margin (Latest) ⓘ | 20.81% | 13.20% |
| Operating Margin (5Y Median) ⓘ | 21.77% | 11.80% |
| Debt to Equity (Latest) ⓘ | 20.01% | 40.56% |
| Profit Margin (Latest) ⓘ | 15.65% | 6.43% |
| Free Cash Flow (Latest) ⓘ | $468.37M | |
Momentum (Price trend) | ||
| 3Y Return ⓘ | +29.14% | +68.89% |
| 12M Return (excl. last month) ⓘ | -8.48% | +30.21% |
| 6M Return ⓘ | -3.52% | -4.16% |
| Price vs. 200-Day MA ⓘ | -7.10% | -1.27% |
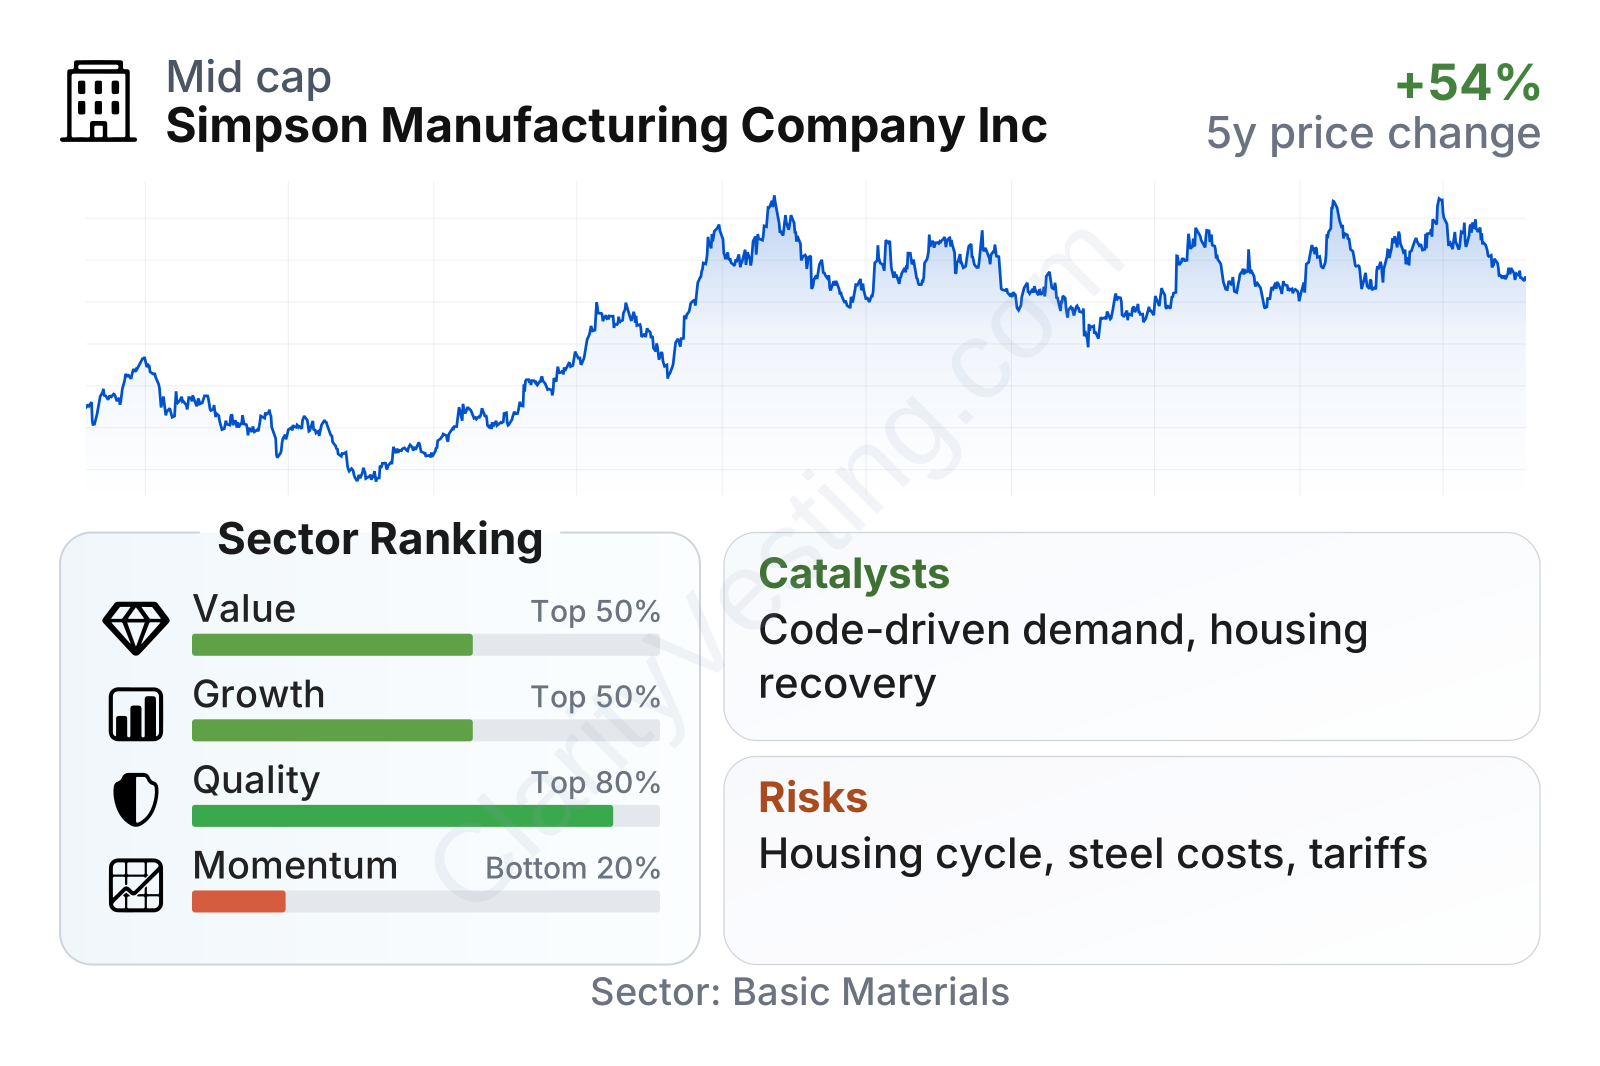
Simpson Manufacturing sits in the mid-to-large range within its industry, with a market value around $7 billion and a stock that has shown above-average volatility. The quality profile is the standout feature: returns on capital and assets are clearly above sector norms, profit margins are strong, and leverage is low. Growth metrics are more mixed in the short term, but the longer-term record for revenue per share, book value per share, and free cash flow compares well with many peers.
The weaker area is recent stock performance rather than business quality. Momentum measures rank near the bottom of the sector, which means the share price has lagged even though the operating profile remains solid. That gap between business strength and market enthusiasm is often an important part of the valuation discussion.
Growth
Simpson operates in a sector that should keep benefiting from long-term structural needs, even if yearly demand moves up and down with housing activity and interest rates. New home construction, repair and remodeling, resilience upgrades, stricter building codes, and demand for safer structures all support the use of engineered connectors and fastening systems. In simple terms, the company sells products that are needed when builders want strength, compliance, and reduced installation risk.
The company’s strategy also makes practical sense for future growth. It focuses on products that are small in cost compared with the total project budget, but essential in function. That tends to support pricing power and customer stickiness. Simpson also invests in new fastener systems, engineered solutions, software tools, and international expansion, while keeping a disciplined manufacturing and distribution footprint. Acquisitions have also been part of the playbook, especially where they deepen product coverage or extend reach in adjacent markets.
Revenue growth has normalized from the unusually strong post-pandemic construction period, but the more recent trend still points to continued expansion rather than contraction. The latest year-over-year growth rate is in the mid-single digits, which is below the sector median but consistent with a company coming off a higher base and operating in a mature category. More important for long-term readers, the five-year revenue per share growth rate remains comfortably ahead of the sector median.
Cash generation has been another favorable point. Free cash flow has been volatile from year to year, which is normal in industrial businesses due to working capital and investment timing, but the longer-term trajectory is clearly upward. The five-year free cash flow growth rate is far ahead of the sector median, and trailing free cash flow remains substantial. That gives the company room to fund capital spending, acquisitions, dividends, and balance-sheet flexibility without relying heavily on debt.
A meaningful catalyst in the current environment is the continued push toward building-code enforcement and resilient construction, particularly in regions exposed to seismic risk, hurricanes, or other severe weather. Simpson’s brand is closely associated with compliance-oriented hardware, so stricter standards can expand both unit demand and product mix. Another opportunity is the gradual recovery in residential construction if financing conditions improve, since that would directly support volumes across the company’s core portfolio.
Risks
This article is for informational purposes only and does not constitute financial advice. Some content is AI-generated. See Disclaimer


