Stock Analysis · Seaport Therapeutics Inc (SPTX)
Overview
Seaport Therapeutics is a clinical-stage biotechnology company focused on medicines for disorders of the central nervous system, including depression, anxiety, and other neuropsychiatric conditions. In simple terms, it is trying to develop new brain-related medicines that aim to improve efficacy and tolerability by changing how well-known drug mechanisms are delivered in the body. The company’s programs are still in development, so its value today depends far more on future clinical results than on current product sales.
Its pipeline has centered on internally developed candidates and a technology approach designed to create oral medicines with differentiated properties. Based on public company materials, Seaport’s leading programs have included SPT-300 for major depressive disorder and anxiety-related indications, SPT-100 for mood disorders, and earlier-stage assets targeting other neuropsychiatric needs. Because the company is still in the clinical stage, commercial execution has not started yet.
Seaport currently does not report product revenue. For 2025, total revenue was 0%, which means the business is effectively funded by cash raised from investors rather than sales of approved medicines. That also means there is no meaningful revenue mix to rank from largest to smallest at this stage.
- Product revenue: 0% as of 2025, because the company does not yet have approved products on the market.
- Collaboration or licensing revenue: no meaningful contribution disclosed in the latest annual results.
- Financing activities: not revenue in accounting terms, but currently the main source of operating funding through cash raised from equity capital.
The cost structure reflects a classic development-stage biotech profile. Operating expenses increased materially in 2025, driven mainly by research and development as programs moved forward. Research and development represented the largest operating cost, while general and administrative spending was the second major expense line.
The expense profile shows a business that is intensifying development work rather than generating sales. Research spending rose sharply year over year, which is usually a sign that more clinical activity is underway, but it also means cash consumption is increasing before any product revenue exists.
Key Figures
| Metric | Value | Sector ⓘ |
|---|---|---|
| Date | Oct 17, 2026 | |
| Context | ||
| Sector | Healthcare | |
| Industry | Biotechnology | |
| Market Cap ⓘ | $1.08B | |
| Beta ⓘ | N/A | |
Value (Cheapness) | ||
| P/E Ratio ⓘ | N/A | 24.79 |
| P/B Ratio ⓘ | 2.40 | 3.08 |
| FCF Yield ⓘ | N/A | 3.15% |
| Dividend Yield ⓘ | N/A | 1.94% |
| EBIT / EV ⓘ | N/A | 0.57% |
| PEG ⓘ | N/A | |
Growth (Business expansion) | ||
| Revenue Growth ⓘ | N/A | 7.45% |
| RPS Growth (5Y CAGR) ⓘ | N/A | 8.61% |
| EPS Growth (5Y CAGR) ⓘ | N/A | -17.81% |
| BVPS Growth (5Y CAGR) ⓘ | N/A | 3.72% |
| Margin Growth (5Y Trend) ⓘ | N/A | -0.62% |
| FCF Growth (5Y CAGR) ⓘ | N/A | 1.04% |
| DPS Growth (5Y CAGR) ⓘ | N/A | 6.77% |
Quality (Business durability) | ||
| ROIC (Latest) ⓘ | N/A | 3.24% |
| ROA (Latest) ⓘ | N/A | 3.01% |
| ROIC (5Y Median) ⓘ | N/A | 4.60% |
| ROA (5Y Median) ⓘ | N/A | 1.89% |
| Net Debt / EBIT (Latest) ⓘ | N/A | 1.34 |
| Net Debt / EBIT (5Y Median) ⓘ | N/A | 1.84 |
| Net Debt / EBITDA (Latest) ⓘ | N/A | 1.00 |
| Net Debt / Assets ⓘ | -13.40% | 5.45% |
| EBITDA / Interest ⓘ | N/A | 9.64 |
| Operating Margin (Latest) ⓘ | N/A | 9.27% |
| Operating Margin (5Y Median) ⓘ | N/A | 7.38% |
| Debt to Equity (Latest) ⓘ | 1.19% | 28.58% |
| Profit Margin (Latest) ⓘ | N/A | 3.59% |
| Free Cash Flow (Latest) ⓘ | N/A | |
Momentum (Price trend) | ||
| 3Y Return ⓘ | N/A | +42.80% |
| 12M Return (excl. last month) ⓘ | N/A | +18.50% |
| 6M Return ⓘ | +189400.00% | +7.57% |
| Price vs. 200-Day MA ⓘ | N/A | +5.12% |
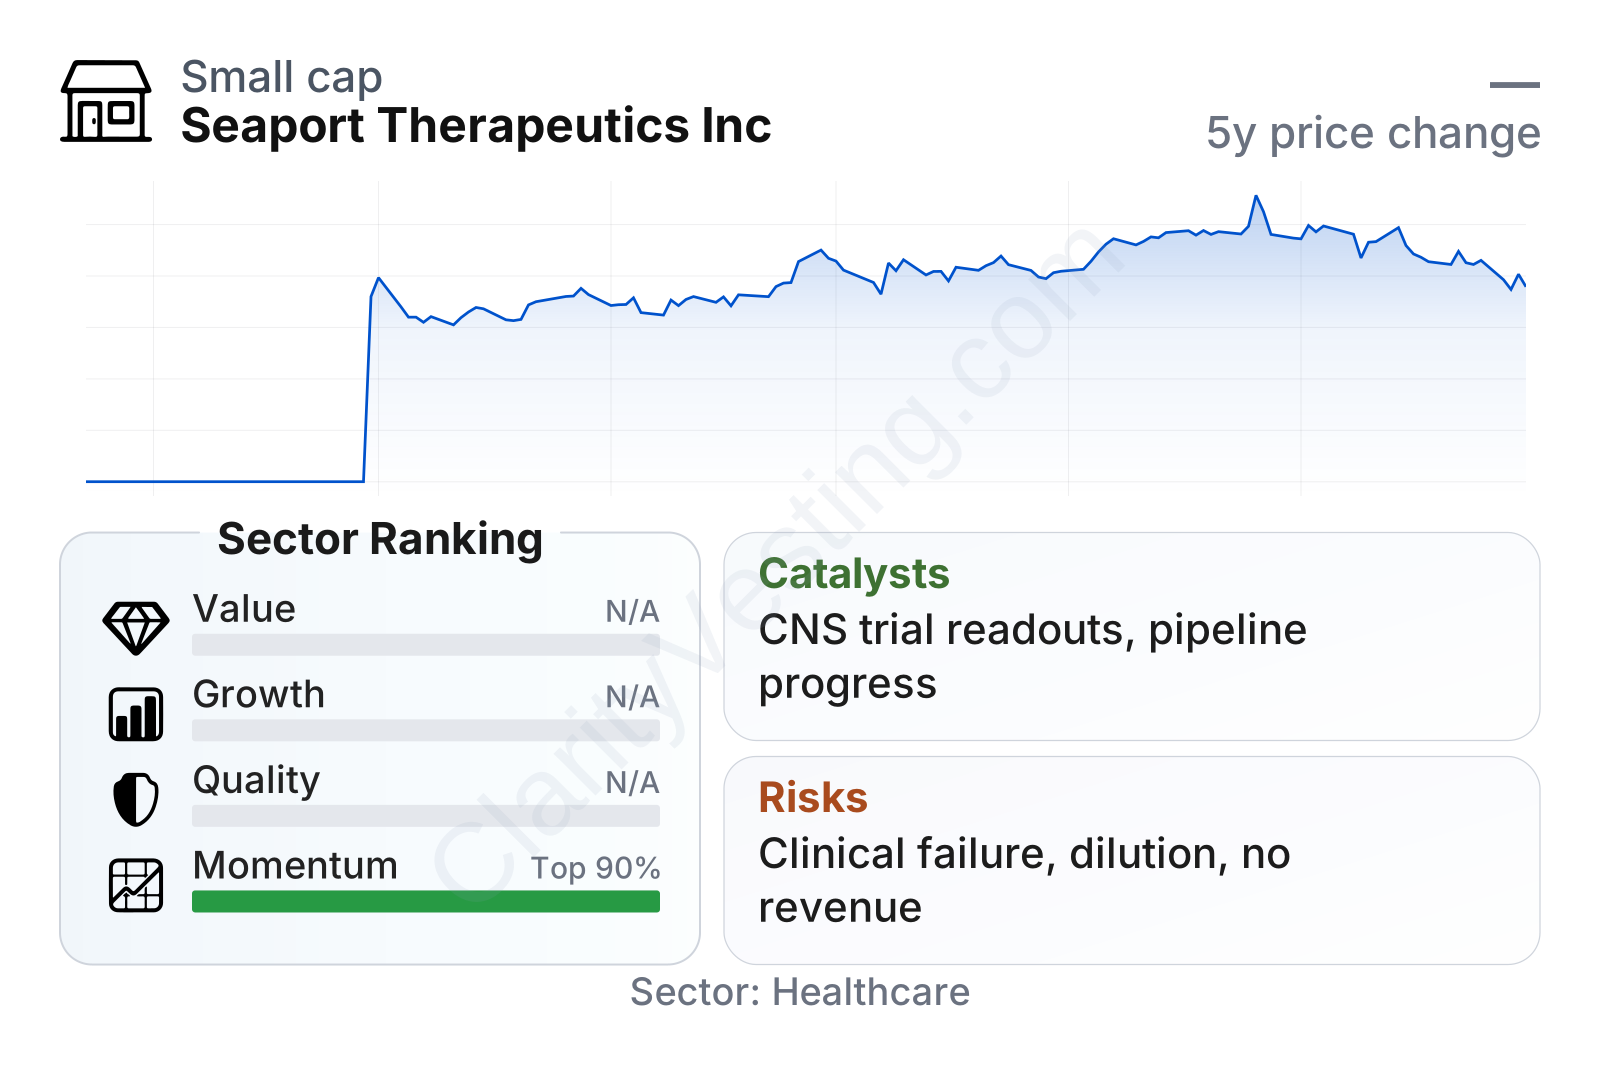
The numbers portray an early-stage biotech with a public valuation around the $1 billion range, no earnings, no revenue, and very limited debt. On traditional valuation measures, several common ratios are either not meaningful or unavailable because the company is still loss-making. The balance sheet appears relatively clean, with debt-to-equity near 1% versus a sector median close to 29%, and net debt relative to assets remains negative, which generally indicates more cash than debt. Momentum has been unusually strong since the stock began trading publicly, but that strength sits on a very short market history and should not be treated as proof of business durability.
Growth
The company operates in a part of healthcare that continues to attract attention: brain and mental health disorders remain large, underserved markets, and many existing treatments still have limitations around onset, efficacy, side effects, or convenience. That gives successful new entrants room to create value, especially if they can show a clinically meaningful improvement over current standards of care.
Seaport’s strategy is logical for this setting. Rather than trying to invent entirely new biology from scratch across every program, it is using a platform approach to redesign known mechanisms with the goal of producing more practical and potentially better-tolerated medicines. That can reduce some scientific uncertainty compared with completely unproven targets, although it does not remove development risk.
The main growth catalysts are tied to clinical progress. For a company like Seaport, each trial update can significantly reshape market expectations because there is no established revenue base to anchor valuation. Advancing lead assets into later-stage studies, reporting favorable safety or efficacy data, or showing a clear differentiation profile versus existing therapies would all be meaningful developments. Progress in major depressive disorder is especially important because it is a very large market and a positive signal there could increase the strategic value of the broader platform.
Recent public company communications have also highlighted continued pipeline advancement and financing activity that supports near-term development plans. For long-term analysis, that matters because early biotech companies often face a tradeoff between scientific progress and the need to repeatedly raise capital. A company that can continue funding multiple clinical programs without heavy reliance on debt is typically in a stronger position to pursue milestones on schedule.
Risks
This article is for informational purposes only and does not constitute financial advice. Some content is AI-generated. See Disclaimer


