Stock Analysis · Sinopec Kantons Holdings Ltd (SPKOY)
Overview
Sinopec Kantons Holdings Ltd is a Hong Kong-listed energy infrastructure company tied to the Sinopec group. Its role is not oil drilling or refining. Instead, it operates in the midstream part of the value chain: crude oil jetty and storage services, logistics-related operations, and investments that generate profit contributions from energy-related assets. This makes the business more infrastructure-like than a typical commodity producer.
The company’s reported revenue is mainly generated by its crude oil terminal and storage activities, especially services connected to unloading, handling, and storing crude oil for large customers. In addition, a very important part of overall profit comes from investment income and share of results from associates and joint ventures, which can make net income much larger than reported operating revenue in some years.
Based on recent annual disclosures and the company’s reporting structure, the main economic drivers can be summarized as follows:
- Crude oil jetty and storage services: approximately 85% to 95% of reported revenue in recent years. This includes port-related handling, unloading, and storage of crude oil.
- Other terminal, logistics, and related services: approximately 5% to 15% of reported revenue, depending on the year and activity mix.
- Share of results from associates and joint ventures / investment income: a much smaller share of reported revenue, but often a very large share of total profit. This includes earnings from stakes in assets and businesses not fully consolidated into revenue.
This structure is important for long-term analysis because the company can look modest in sales, yet much stronger in earnings and cash generation due to those equity-accounted investments. Revenue has stayed fairly stable in a band around the mid-HK$600 million range in recent years, while profitability has been far more volatile because of non-operating and investment-related contributions.
The business mix shows a relatively steady top line and healthy gross profitability from infrastructure services. At the same time, the large gap between operating revenue and net income in some years suggests that bottom-line results depend heavily on items beyond basic terminal operations. That can be attractive when those investments perform well, but it also makes the earnings profile less straightforward than a plain fee-based midstream operator.
Key Figures
| Metric | Value | Sector ⓘ |
|---|---|---|
| Date | Oct 17, 2026 | |
| Context | ||
| Sector | Energy | |
| Industry | Oil & Gas Midstream | |
| Market Cap ⓘ | $1.16B | |
| Beta ⓘ | 0.35 | |
Value (Cheapness) | ||
| P/E Ratio ⓘ | 10.67 | 15.44 |
| P/B Ratio ⓘ | 0.07 | 1.73 |
| FCF Yield ⓘ | 126.72% | 8.20% |
| Dividend Yield ⓘ | 6.83% | 3.59% |
| EBIT / EV ⓘ | N/A | 7.46% |
| PEG ⓘ | N/A | |
Growth (Business expansion) | ||
| Revenue Growth ⓘ | 15.00% | 26.90% |
| RPS Growth (5Y CAGR) ⓘ | 0.81% | 6.90% |
| EPS Growth (5Y CAGR) ⓘ | 29.76% | -15.73% |
| BVPS Growth (5Y CAGR) ⓘ | 1.81% | 6.07% |
| Margin Growth (5Y Trend) ⓘ | 17.81% | 0.58% |
| FCF Growth (5Y CAGR) ⓘ | -30.32% | 1.86% |
| DPS Growth (5Y CAGR) ⓘ | 5.74% | 16.79% |
Quality (Business durability) | ||
| ROIC (Latest) ⓘ | N/A | 11.40% |
| ROA (Latest) ⓘ | 11.35% | 6.06% |
| ROIC (5Y Median) ⓘ | 1.09% | 10.30% |
| ROA (5Y Median) ⓘ | 6.59% | 5.42% |
| Net Debt / EBIT (Latest) ⓘ | -1.54 | 1.64 |
| Net Debt / EBIT (5Y Median) ⓘ | -2.01 | 1.83 |
| Net Debt / EBITDA (Latest) ⓘ | -0.78 | 1.08 |
| Net Debt / Assets ⓘ | -3.10% | 17.29% |
| EBITDA / Interest ⓘ | 428.95 | 9.64 |
| Operating Margin (Latest) ⓘ | 25.85% | 16.27% |
| Operating Margin (5Y Median) ⓘ | 29.53% | 20.39% |
| Debt to Equity (Latest) ⓘ | 0.16% | 54.76% |
| Profit Margin (Latest) ⓘ | 120.83% | 8.82% |
| Free Cash Flow (Latest) ⓘ | $1.47B | |
Momentum (Price trend) | ||
| 3Y Return ⓘ | +36.55% | +67.38% |
| 12M Return (excl. last month) ⓘ | -7.54% | +49.19% |
| 6M Return ⓘ | -9.96% | +7.07% |
| Price vs. 200-Day MA ⓘ | +35.35% | +9.56% |
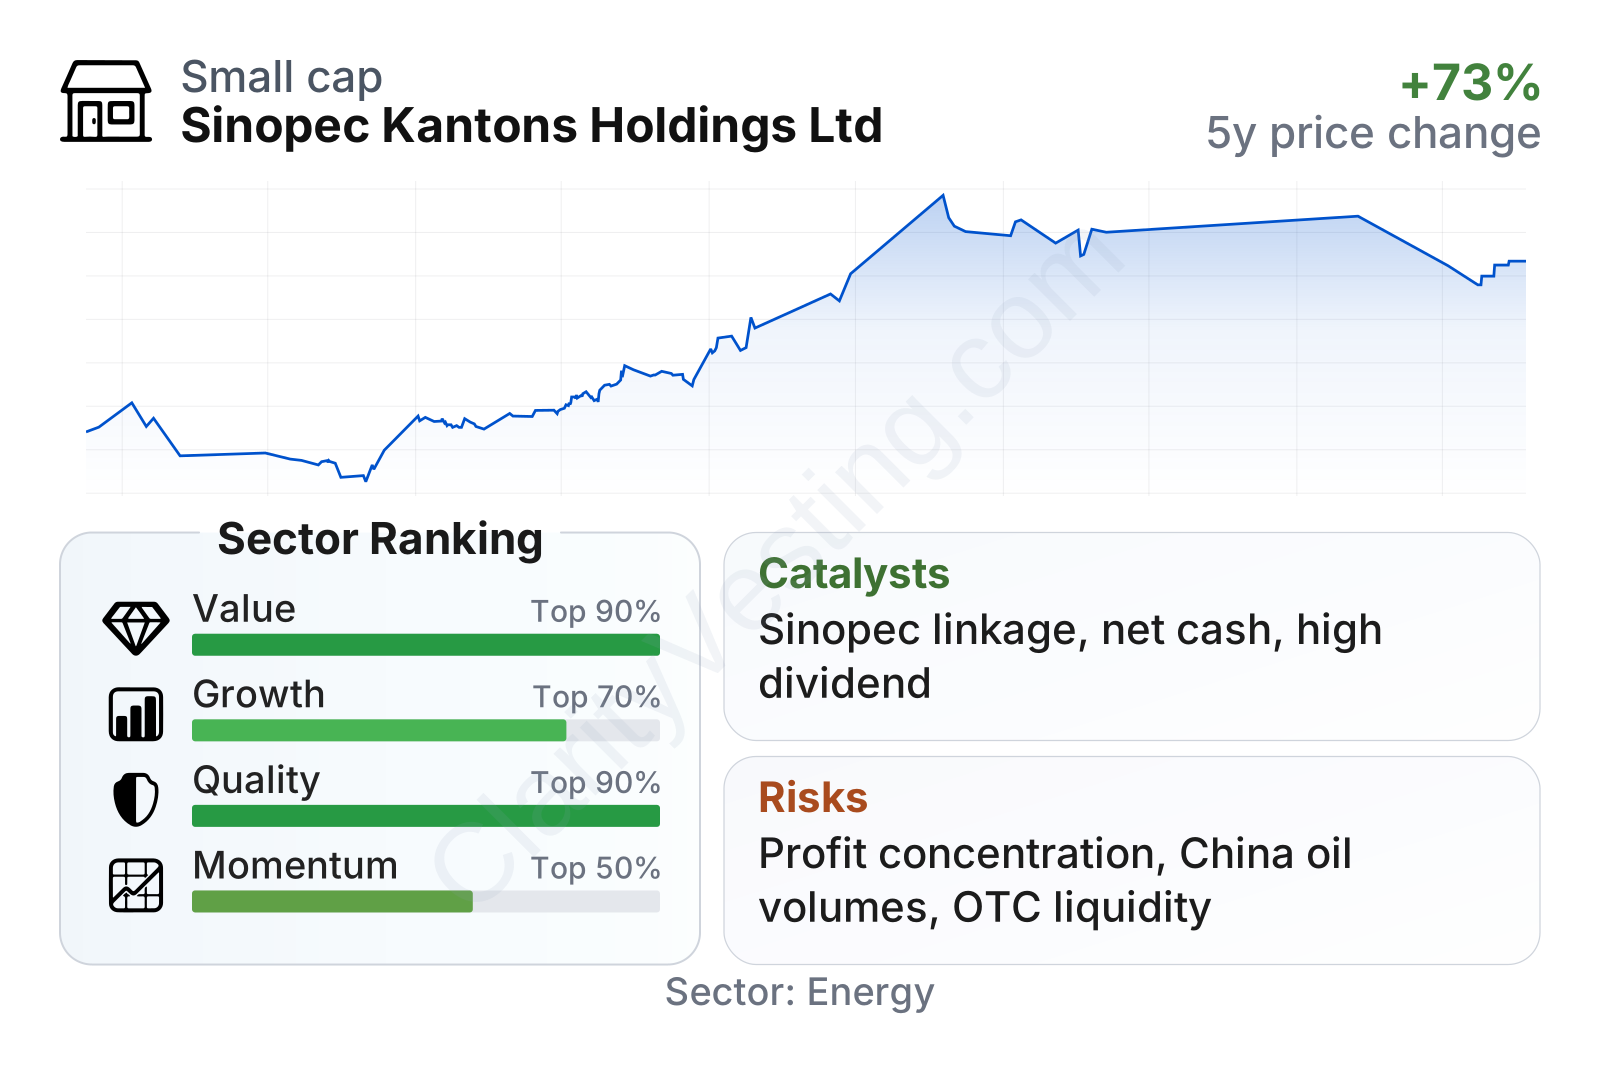
The recent market profile points to a small-cap energy infrastructure company with unusually strong balance-sheet quality and very low share-price sensitivity versus the broader market. Valuation ratios look inexpensive relative to the energy sector median, with a lower earnings multiple, an extremely low price-to-book ratio, and a free cash flow yield far above typical peers. Income generation is also notable, with a trailing dividend yield around 7%.
Operational quality stands out more than growth. Operating margin is roughly 26%, above the sector median, and balance-sheet leverage is exceptionally conservative: debt-to-equity is close to 0%, net debt is negative, and interest coverage is extremely high. In simple terms, the company holds more cash than debt and faces little financing pressure.
Growth signals are more mixed. Year-over-year revenue growth has been positive, but longer-term revenue-per-share growth has been weak. Earnings per share over five years have improved strongly, yet free cash flow over the same period has been volatile and trending lower. Share performance has been solid over three years, though recent shorter-term returns have lagged many energy names despite the price still sitting well above its long-term moving average.
Growth
Sinopec Kantons operates in a sector that should remain relevant for years: crude oil import infrastructure, storage, and logistics. Even with global energy transition efforts, large parts of Asia, and especially China, still rely on oil supply chains that need ports, terminals, and storage capacity. That gives the company exposure to an essential part of the energy system without taking direct exploration risk.
Its strategy also makes sense in a practical way. Infrastructure assets with long useful lives, recurring service demand, and close links to a major state-backed industrial group can provide stability. The company’s association with Sinopec is meaningful because it supports customer access, asset relevance, and integration into a very large petroleum supply network.
A key growth catalyst is not necessarily rapid revenue expansion, but the ability to keep monetizing strategic assets efficiently while preserving high margins and strong cash conversion. If crude import activity remains resilient and terminal utilization stays healthy, the company can continue producing solid operating profit from a relatively stable asset base.
Another potential catalyst is capital allocation. Because the balance sheet is very lightly leveraged and net cash is positive, the company has room to maintain distributions, support selective expansion, or increase returns from existing assets. For a business of this size, financial flexibility can matter as much as headline growth.
Recent annual results also indicate that the company continues to generate very strong profitability despite only moderate changes in revenue. That suggests earnings are being supported not only by core operations but also by the value of its invested assets. If those associated businesses continue performing well, they can remain a meaningful earnings lever even without major top-line growth.
Risks
This article is for informational purposes only and does not constitute financial advice. Some content is AI-generated. See Disclaimer


