Stock Analysis · S&P Global Inc (SPGI)
Overview
S&P Global is a large financial information company that sells data, analytics, benchmarks, credit ratings, and market infrastructure services. In simple terms, it helps governments, companies, banks, asset managers, insurers, and traders make decisions by providing information they can use to raise money, assess risk, follow markets, build indexes, and process trades. Its best-known brands include S&P Ratings, S&P Dow Jones Indices, and the Market Intelligence platform. Since the 2022 merger with IHS Markit, the company has become broader and less dependent on any single business line.
The company organizes its business into five segments, with revenue spread across both recurring subscriptions and more cyclical transaction-linked activity. Based on recent annual reporting, the main sources of revenue are approximately:
- Market Intelligence: about 28% of revenue. This segment sells financial data, desktop tools, research, pricing, and workflow products used by investment professionals, corporations, and banks.
- Ratings: about 24% of revenue. This is the credit rating business, where S&P Global rates bonds and other debt issued by corporations, governments, and structured finance vehicles.
- Commodity Insights: about 19% of revenue. This unit provides data, benchmarks, and analysis for energy, commodities, and the energy transition.
- Mobility: about 15% of revenue. This business supplies automotive data and forecasting used by car manufacturers, suppliers, dealers, and lenders.
- Indices: about 10% of revenue. It earns fees from index-linked assets, licensing, exchange-traded products, and benchmark services through S&P Dow Jones Indices.
- Engineering Solutions: about 4% of revenue. This smaller unit provides technical standards and engineering workflow information.
This mix matters for long-term analysis. Ratings can be very profitable but can rise and fall with debt issuance activity. By contrast, data subscriptions, index licensing, and many commodity information services are steadier and tend to renew annually. That gives S&P Global a combination of resilience and cyclical upside.
The long-term picture is favorable: revenue has risen meaningfully over the last several years, while operating income and net income have also expanded. Margins remain high for a company of this size, showing that once its information products are built, additional sales can be very profitable.
Key Figures
| Metric | Value | Sector ⓘ |
|---|---|---|
| Date | Oct 17, 2026 | |
| Context | ||
| Sector | Financial Services | |
| Industry | Financial Data & Stock Exchanges | |
| Market Cap ⓘ | $120.45B | |
| Beta ⓘ | 1.09 | |
Value (Cheapness) | ||
| P/E Ratio ⓘ | 24.96 | 12.26 |
| P/B Ratio ⓘ | 4.74 | 1.23 |
| FCF Yield ⓘ | 4.63% | 10.40% |
| Dividend Yield ⓘ | 0.94% | 3.02% |
| EBIT / EV ⓘ | 4.51% | 8.14% |
| PEG ⓘ | 1.94 | |
Growth (Business expansion) | ||
| Revenue Growth ⓘ | 10.40% | 9.35% |
| RPS Growth (5Y CAGR) ⓘ | 10.01% | 12.19% |
| EPS Growth (5Y CAGR) ⓘ | -3.43% | -9.53% |
| BVPS Growth (5Y CAGR) ⓘ | 80.50% | 4.99% |
| Margin Growth (5Y Trend) ⓘ | -9.15% | -3.86% |
| FCF Growth (5Y CAGR) ⓘ | 11.24% | 4.81% |
| DPS Growth (5Y CAGR) ⓘ | 5.69% | 8.79% |
Quality (Business durability) | ||
| ROIC (Latest) ⓘ | 12.08% | 9.49% |
| ROE (Latest) ⓘ | 17.85% | 13.90% |
| ROA (Latest) ⓘ | 8.03% | 1.55% |
| ROIC (5Y Median) ⓘ | 11.36% | 7.86% |
| ROE (5Y Median) ⓘ | 16.25% | 12.17% |
| ROA (5Y Median) ⓘ | 7.36% | 1.30% |
| Net Debt / EBIT (Latest) ⓘ | 1.65 | 0.96 |
| Net Debt / EBIT (5Y Median) ⓘ | 1.91 | 0.73 |
| Net Debt / EBITDA (Latest) ⓘ | 1.41 | 0.92 |
| Operating Margin (Latest) ⓘ | 43.55% | 22.30% |
| Operating Margin (5Y Median) ⓘ | 42.48% | 24.63% |
| Debt to Equity (Latest) ⓘ | 49.81% | 58.56% |
| Profit Margin (Latest) ⓘ | 30.54% | 26.57% |
| Free Cash Flow (Latest) ⓘ | $5.57B | |
Momentum (Price trend) | ||
| 3Y Return ⓘ | +25.16% | +88.33% |
| 12M Return (excl. last month) ⓘ | -19.13% | +19.38% |
| 6M Return ⓘ | +4.76% | +4.75% |
| Price vs. 200-Day MA ⓘ | +1.43% | +3.50% |
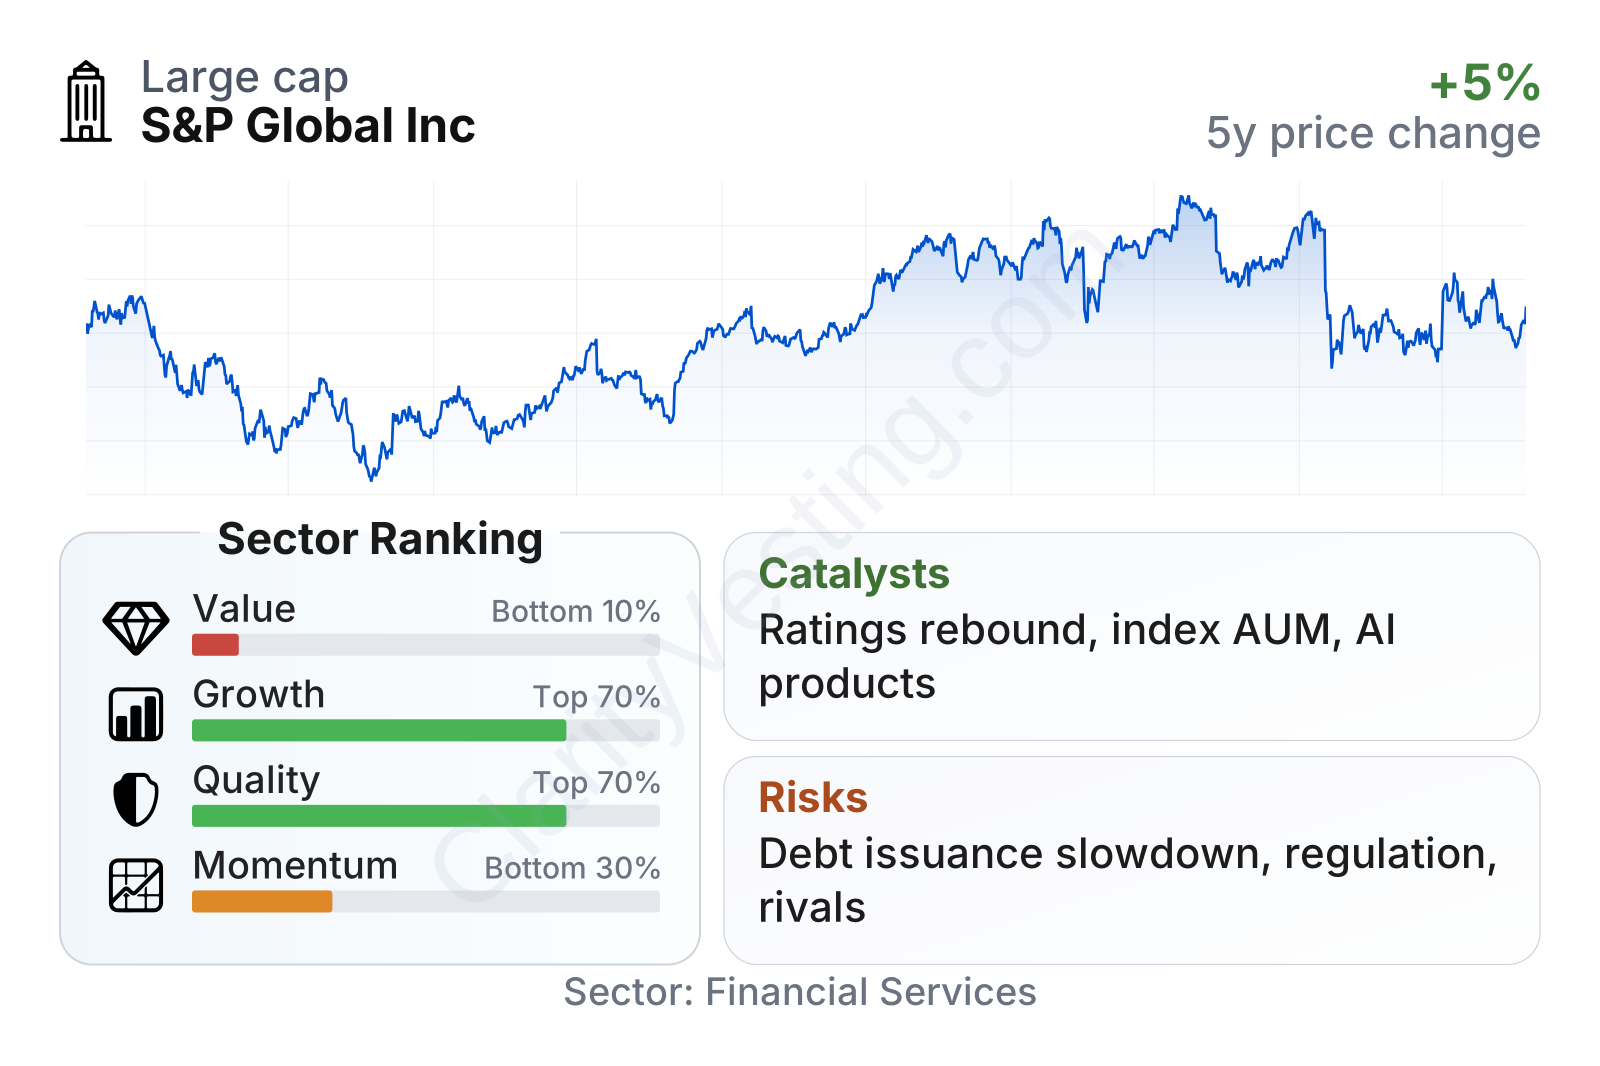
S&P Global stands out more for business quality than for cheapness. Profitability metrics are above the sector median, with operating margin around the mid-40% range and returns on capital, equity, and assets also ahead of many peers. Free cash flow generation is strong in absolute terms, but the stock’s cash flow yield and dividend yield are lower than sector norms, which points to a premium valuation. Growth is positive rather than explosive, and recent share-price momentum has been weaker than much of the broader financial services group.
Growth
S&P Global operates in areas with durable structural demand. Financial markets continue to generate more data, regulations continue to require measurement and reporting, passive investing keeps increasing the importance of indexes, and energy markets are becoming more complex as the world adds new fuels, carbon products, power-market tools, and transition-related analytics. These trends support the company’s core businesses without requiring unusually optimistic assumptions.
The strategy also makes sense. The merger with IHS Markit expanded the company into energy, transportation, supply chains, automotive information, and private market data. Management has been focusing on integrating products across platforms, cross-selling to existing clients, and using generative AI and automation to improve workflow tools. For a data company, this is a logical path: once customers rely on a platform for daily work, switching becomes inconvenient and renewal rates tend to improve.
Earnings per share show a dip after 2021 followed by a solid recovery through 2024 and 2025. That pattern matches what would be expected from a business with a cyclical ratings arm and a large integration program after a major acquisition. The key point is that earnings have resumed an upward path rather than staying depressed.
Book value per share became much larger after the IHS Markit combination, reflecting the balance sheet impact of the merger. Since then it has edged down, which is not unusual for an asset-light information company that returns cash to shareholders and carries a large amount of intangible assets. For this type of business, earnings power and cash flow usually matter more than book value trends alone.
One important catalyst is the ratings business. When bond issuance, refinancing, and structured finance activity improve, S&P Ratings can grow quickly because the incremental economics are attractive. Another catalyst is the index business, where rising assets tied to benchmarks can lift high-margin licensing revenue. In commodities, the energy transition is creating demand for pricing, benchmarks, emissions data, and power-market analysis. These are all areas where S&P Global already has established products and customer relationships.
Recent company communications have also emphasized AI-enabled product development and workflow enhancements across Market Intelligence and other divisions. For a business built on proprietary content, AI is less about replacing the core asset and more about making that asset easier to search, analyze, and embed into customer decisions. If executed well, that can support pricing power and retention.
Risks
This article is for informational purposes only and does not constitute financial advice. Some content is AI-generated. See Disclaimer


