Stock Analysis · Simon Property Group Inc (SPG)
Overview
Simon Property Group is a real estate investment trust, or REIT, focused mainly on large retail properties. In simple terms, it owns, develops, and operates shopping destinations where retailers, restaurants, entertainment brands, and service businesses rent space. Its portfolio is concentrated in high-quality malls, premium outlets, and mixed-use properties in the United States, with additional international interests through joint ventures and partnerships.
The business model is fairly straightforward: Simon collects rent and other property-related income from tenants, earns revenue tied to sales-based leases in some cases, and benefits from management, development, and investment activities connected to its properties and partners. Because it owns many of the best-located retail assets in its category, its strategy is less about broad retail exposure and more about controlling prime destinations that can keep attracting foot traffic, brands, and redevelopment opportunities.
Based on company reporting, Simon’s revenue mix is led by leasing and occupancy-related income from its U.S. properties, while the remainder comes from management fees, development and redevelopment activity, tenant reimbursements, and income from other platform investments and international interests. A simplified breakdown looks like this:
- Lease income from U.S. malls and premium outlets: approximately 70% to 80% of total revenue. This includes base minimum rent and other rent generated by retail tenants in Simon’s core domestic portfolio.
- Tenant recoveries and ancillary property revenue: approximately 10% to 20%. This generally includes reimbursements for common area maintenance, real estate taxes, utilities, parking, advertising, and similar property-level charges.
- Management, development, and other fees; platform and investment-related income: approximately 5% to 10%. This includes fees and earnings tied to joint ventures, property management, and other complementary activities.
- International and other investment income: the remaining share, which can vary from year to year depending on joint venture performance, property sales, and accounting items.
Over the last several years, the company’s revenue has moved upward while operating profitability has strengthened, showing that rent collection, tenant demand, and cost discipline have improved together rather than one at the expense of the other.
The profit flow shows a business with unusually high property-level economics for a public retail landlord. Revenue has grown steadily since 2021, while operating income expanded faster than sales, suggesting stronger leasing spreads, better occupancy, and a favorable mix of assets. Interest expense remains meaningful, which is normal for REITs, but it has not prevented margin expansion.
Key Figures
| Metric | Value | Sector ⓘ |
|---|---|---|
| Date | Oct 04, 2026 | |
| Context | ||
| Sector | Real Estate | |
| Industry | REIT - Retail | |
| Market Cap ⓘ | $76.29B | |
| Beta ⓘ | 1.31 | |
Value (Cheapness) | ||
| P/E Ratio ⓘ | 14.18 | 17.35 |
| P/B Ratio ⓘ | 21.54 | 0.86 |
| FCF Yield ⓘ | 4.26% | 7.47% |
| Dividend Yield ⓘ | 4.38% | 4.75% |
| EBIT / EV ⓘ | 6.43% | 3.81% |
| PEG ⓘ | 8.74 | |
Growth (Business expansion) | ||
| Revenue Growth ⓘ | 19.50% | 5.30% |
| RPS Growth (5Y CAGR) ⓘ | 5.81% | 5.96% |
| EPS Growth (5Y CAGR) ⓘ | -6.14% | -11.41% |
| BVPS Growth (5Y CAGR) ⓘ | 7.24% | 0.41% |
| Margin Growth (5Y Trend) ⓘ | 53.00% | 0.53% |
| FCF Growth (5Y CAGR) ⓘ | 3.48% | 5.40% |
| DPS Growth (5Y CAGR) ⓘ | 1.13% | 5.02% |
Quality (Business durability) | ||
| ROIC (Latest) ⓘ | 19.03% | 5.77% |
| ROE (Latest) ⓘ | 194.60% | 7.64% |
| ROA (Latest) ⓘ | 12.57% | 2.85% |
| ROIC (5Y Median) ⓘ | 9.55% | 4.20% |
| ROE (5Y Median) ⓘ | 91.52% | 6.03% |
| ROA (5Y Median) ⓘ | 7.11% | 2.45% |
| Net Debt / EBIT (Latest) ⓘ | 4.67 | 7.57 |
| Net Debt / EBIT (5Y Median) ⓘ | 9.03 | 8.41 |
| Net Debt / EBITDA (Latest) ⓘ | 3.65 | 5.12 |
| Net Debt / Assets ⓘ | 71.54% | 37.84% |
| EBITDA / Interest ⓘ | 7.27 | 4.11 |
| Operating Margin (Latest) ⓘ | 87.55% | 35.40% |
| Operating Margin (5Y Median) ⓘ | 49.60% | 36.59% |
| Debt to Equity (Latest) ⓘ | 663.62% | 89.06% |
| Profit Margin (Latest) ⓘ | 66.57% | 19.99% |
| Free Cash Flow (Latest) ⓘ | $3.25B | |
Momentum (Price trend) | ||
| 3Y Return ⓘ | +125.20% | +30.66% |
| 12M Return (excl. last month) ⓘ | +23.10% | +7.55% |
| 6M Return ⓘ | +8.83% | +0.69% |
| Price vs. 200-Day MA ⓘ | +0.45% | -2.27% |
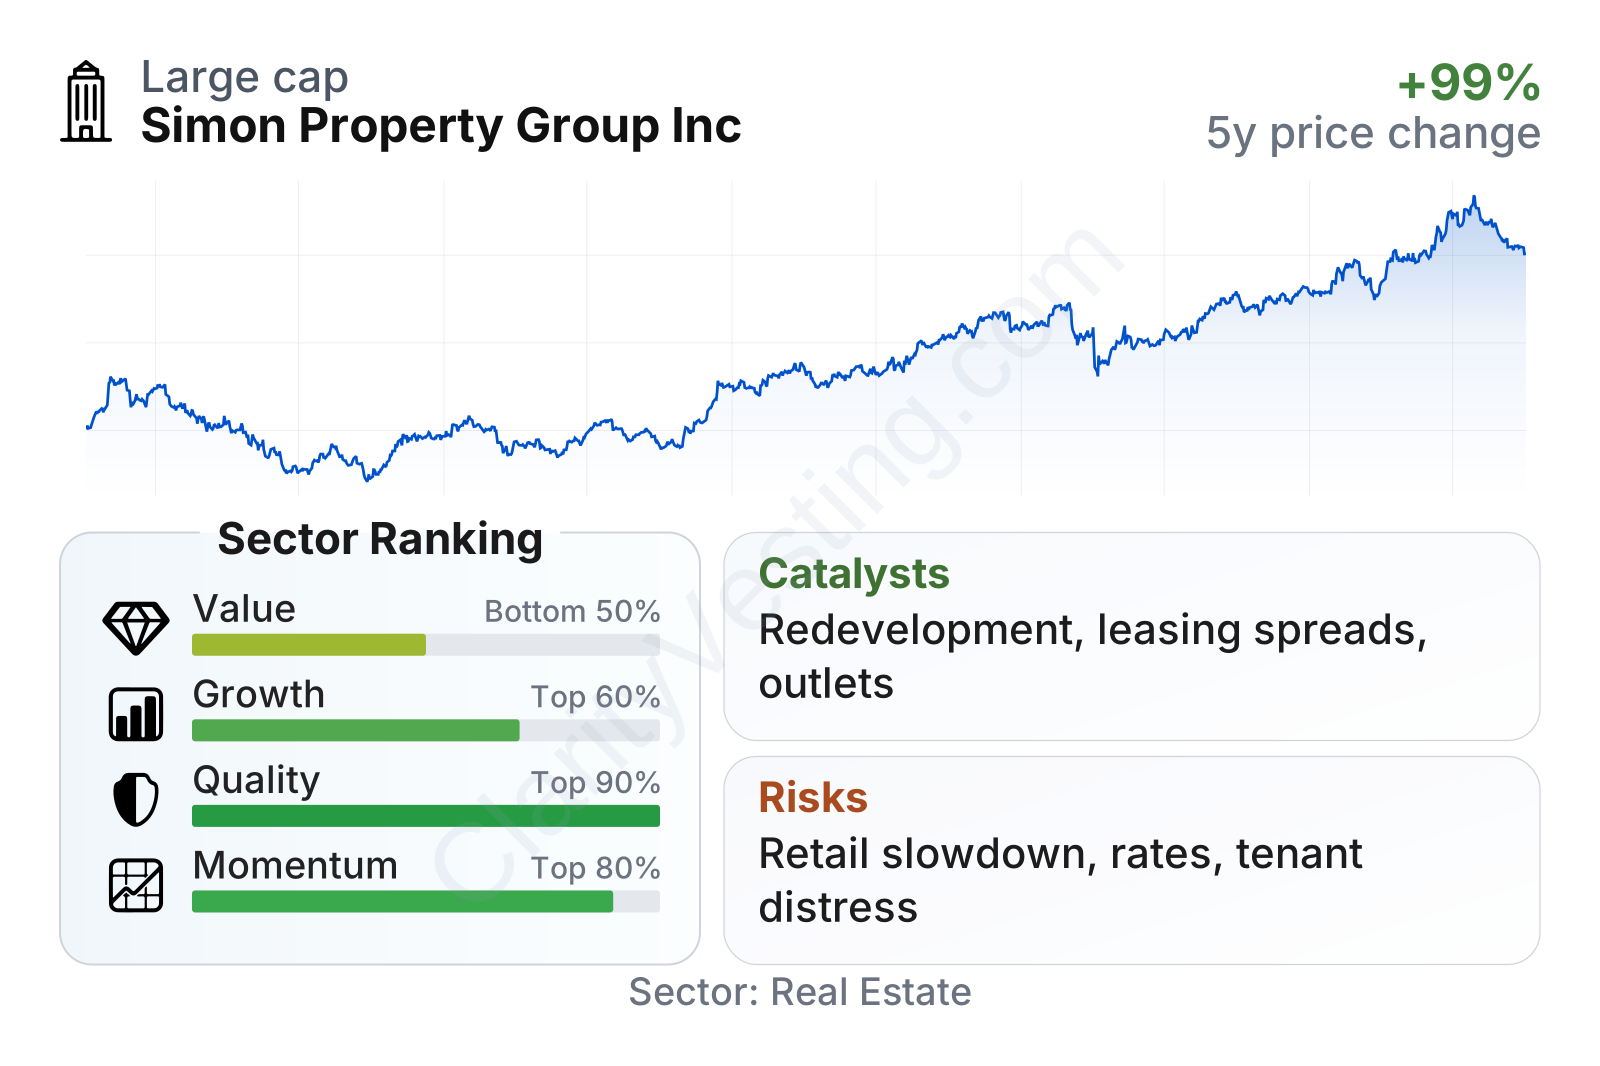
Simon stands out as a very large REIT with above-average quality metrics inside the real estate sector. Profitability, returns on capital, and interest coverage are notably stronger than many peers, while recent share-price performance has also been ahead of the sector. The weaker area is traditional value screening: the earnings multiple is not demanding, but the price-to-book ratio is far above the real estate sector median, which reflects both the premium attached to its asset base and the limits of book value as a comparison tool for top-tier retail property owners.
Growth
Retail real estate is not usually described as a fast-growth segment, but high-end retail destinations have been more resilient than the broader mall market. Simon operates in the strongest part of that niche. The key industry trend is concentration: premium brands, restaurants, entertainment operators, and digitally native retailers increasingly favor proven locations with high traffic and strong tenant sales. That trend tends to benefit landlords that already control the best assets.
Simon’s strategy for future growth is sensible because it does not rely only on building more malls. It combines rent growth, occupancy improvement, redevelopment, mixed-use expansion, and selective brand or platform investments. In practice, this means turning existing properties into broader destinations that can include dining, hotels, residential, offices, or entertainment uses, which can lift productivity per square foot and make the real estate less dependent on one retail format.
Revenue per share has followed a steady upward path over the past five years, which is an encouraging sign for a property owner. It suggests that growth has not come only from financial engineering or asset inflation, but also from improving income generation on a per-share basis.
The dividend per share dipped after the pandemic period and then recovered, with the latest years moving back above prior levels. For a REIT, that pattern matters because it signals that cash generation has normalized enough to support a stronger payout while still funding operations and redevelopment.
Several catalysts can support the next phase. First, Simon continues to benefit from the scarcity value of class-leading malls and outlets, where replacement cost is high and new competing supply is limited. Second, redevelopment can unlock additional income without requiring entirely new large-scale land acquisitions. Third, premium outlet and luxury-oriented retail remain among the healthier categories in physical retail. Fourth, the company’s scale gives it negotiating power with tenants and access to lower-cost capital than many smaller rivals.
Recent company updates have also pointed to continued leasing momentum, strong occupancy, and solid retailer demand for top-tier space. That matters because the best indicator for future growth in this business is often not unit expansion but the ability to keep space full and re-lease it at higher economics.
Risks
This article is for informational purposes only and does not constitute financial advice. Some content is AI-generated. See Disclaimer


