Stock Analysis · Space Exploration Technologies Corp (SPCX)
Overview
Space Exploration Technologies Corp operates in launch services, spacecraft, satellite communications, and related space infrastructure. In simple terms, the company builds rockets, sends payloads into orbit, manufactures satellites, and sells connectivity services that rely on its own space network. That makes it different from many aerospace companies that focus on only one part of the value chain.
The business model appears increasingly diversified, but revenue is still centered on two large engines: launch activities and satellite-based communications. Public information indicates that the company’s communication segment, mainly tied to its satellite internet network and related equipment and services, has become a major contributor alongside launch contracts for commercial customers, governments, and defense agencies. Precise segment disclosure is limited, so any split should be treated as approximate rather than exact.
- Satellite communications and related services: approximately 50% to 60% of revenue. This likely includes recurring subscription revenue, user terminals, enterprise connectivity, mobility solutions, and government connectivity contracts.
- Launch services: approximately 35% to 45% of revenue. This includes missions for commercial satellite operators, civil agencies, and national security customers, as well as rideshare missions and dedicated launches.
- Spacecraft, satellite manufacturing, and other activities: likely a small remaining share. This may include satellite production, mission support, and development work tied to broader space systems.
The recent financial profile shows very rapid top-line expansion. Revenue rose from about $10.4 billion in 2023 to $14.0 billion in 2024 and to about $18.7 billion in 2025. At the same time, profitability has been uneven because the company is spending heavily on research, capacity, and long-duration projects. One notable feature is that gross profit expanded strongly through 2025, but research and development grew even faster, which pushed operating results back into the red. That pattern suggests a company still in a scaling and investment phase rather than a mature cash-harvesting stage.
The flow of revenue and costs points to a business that can generate substantial gross profit, but that is choosing to reinvest aggressively. Research and development surged to an unusually high level in 2025, which helps explain why net income turned negative again despite strong sales growth.
Key Figures
| Metric | Value | Sector ⓘ |
|---|---|---|
| Date | Oct 24, 2026 | |
| Context | ||
| Sector | Industrials | |
| Industry | Aerospace & Defense | |
| Market Cap ⓘ | $1.95T | |
| Beta ⓘ | N/A | |
Value (Cheapness) | ||
| P/E Ratio ⓘ | N/A | 22.29 |
| P/B Ratio ⓘ | 7.34 | 1.98 |
| FCF Yield ⓘ | -1.63% | 6.26% |
| Dividend Yield ⓘ | N/A | 1.92% |
| EBIT / EV ⓘ | -0.03% | 4.83% |
| PEG ⓘ | N/A | |
Growth (Business expansion) | ||
| Revenue Growth ⓘ | 91.90% | 9.30% |
| RPS Growth (5Y CAGR) ⓘ | N/A | 7.76% |
| EPS Growth (5Y CAGR) ⓘ | N/A | -13.17% |
| BVPS Growth (5Y CAGR) ⓘ | N/A | 6.13% |
| Margin Growth (5Y Trend) ⓘ | N/A | 0.74% |
| FCF Growth (5Y CAGR) ⓘ | N/A | 10.79% |
| DPS Growth (5Y CAGR) ⓘ | N/A | 9.41% |
Quality (Business durability) | ||
| ROIC (Latest) ⓘ | N/A | 10.75% |
| ROA (Latest) ⓘ | N/A | 5.41% |
| ROIC (5Y Median) ⓘ | N/A | 9.37% |
| ROA (5Y Median) ⓘ | N/A | 4.95% |
| Net Debt / EBIT (Latest) ⓘ | N/A | 2.04 |
| Net Debt / EBIT (5Y Median) ⓘ | N/A | 2.27 |
| Net Debt / EBITDA (Latest) ⓘ | -6.96 | 1.39 |
| Net Debt / Assets ⓘ | -28.09% | 19.27% |
| EBITDA / Interest ⓘ | 3.62 | 9.58 |
| Operating Margin (Latest) ⓘ | -2.33% | 10.49% |
| Operating Margin (5Y Median) ⓘ | -12.92% | 10.30% |
| Debt to Equity (Latest) ⓘ | 30.94% | 64.82% |
| Profit Margin (Latest) ⓘ | -35.66% | 6.67% |
| Free Cash Flow (Latest) ⓘ | -$31.65B | |
Momentum (Price trend) | ||
| 3Y Return ⓘ | N/A | +67.77% |
| 12M Return (excl. last month) ⓘ | N/A | +12.05% |
| 6M Return ⓘ | N/A | 0.00% |
| Price vs. 200-Day MA ⓘ | N/A | +0.67% |
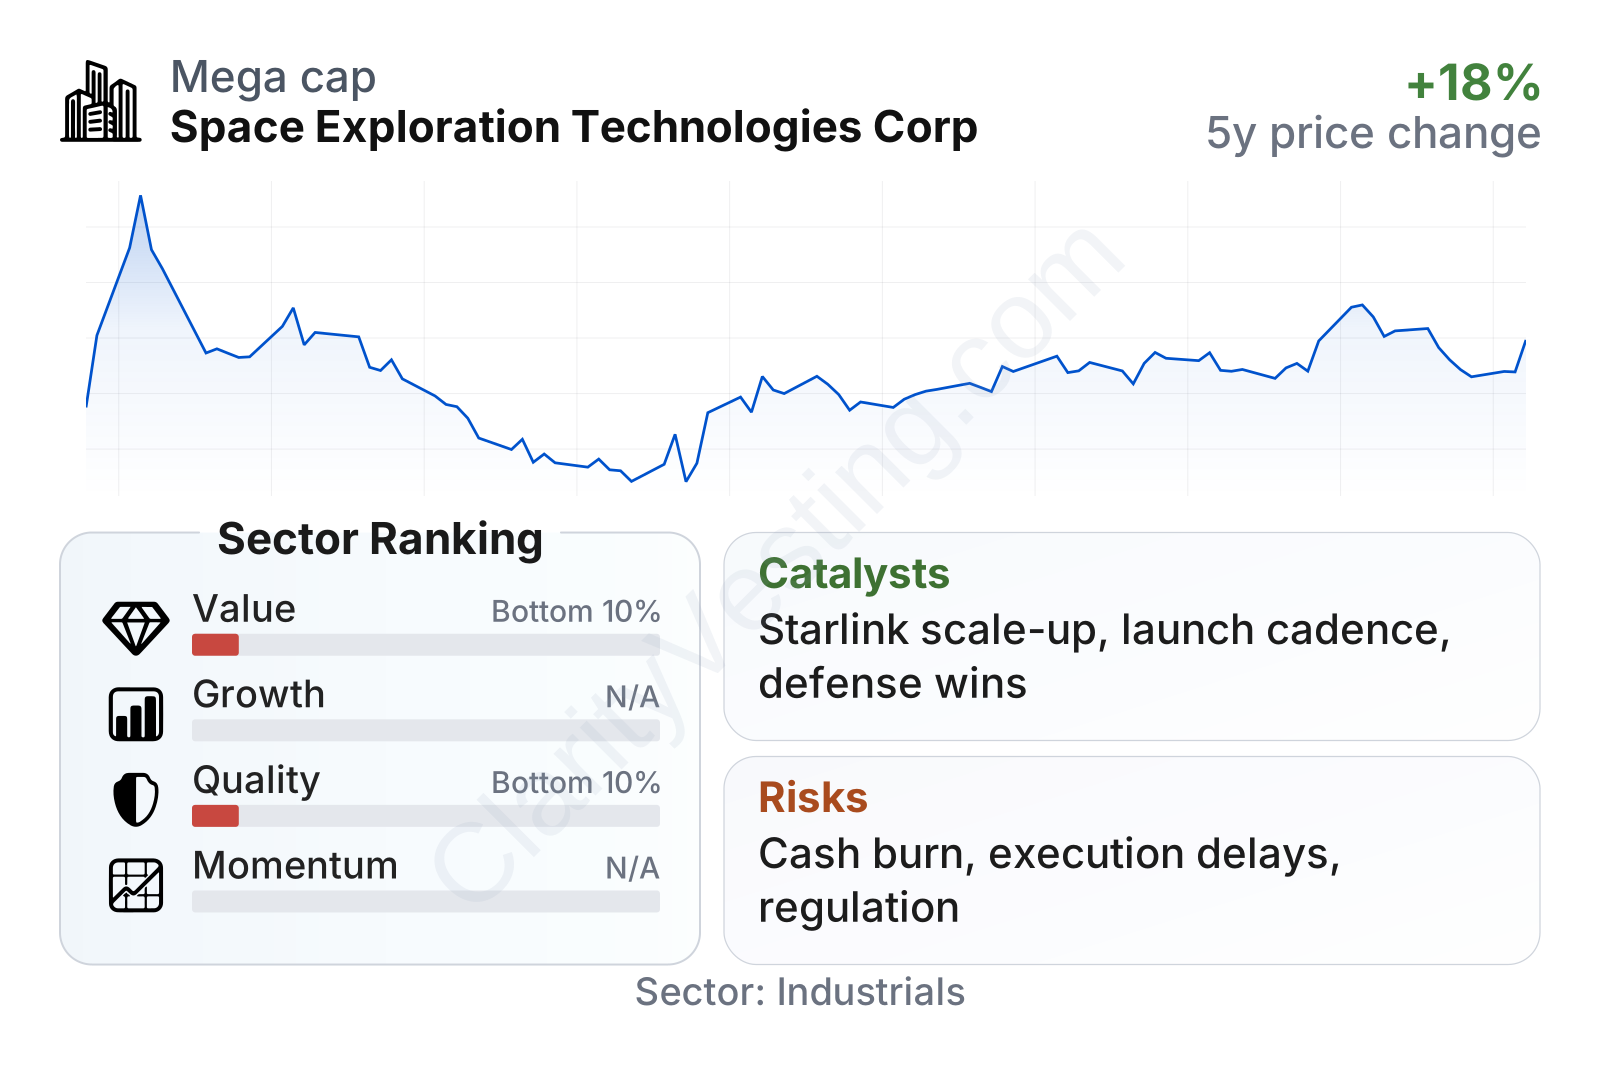
The market profile is that of a very large company, but the operating profile still looks more like a high-investment growth business than a traditional aerospace contractor. Revenue growth is far above the sector median, while valuation measures place the stock in the expensive end of the sector. The balance sheet appears relatively conservative in one important area: debt to equity is around 31%, well below the sector median, and net debt relative to assets is negative, which points to meaningful cash support. On the other hand, profitability and free cash flow remain weak, with a negative profit margin of roughly 36% and trailing free cash flow deeply negative. The recent share price trend has been positive, but the main debate is whether growth can convert into steadier earnings and cash generation.
Growth
The company operates in markets with strong long-term demand drivers. Launch demand is supported by satellite deployment, defense spending, scientific missions, and the growing need for resilient space infrastructure. Satellite internet and orbital communications are also expanding, especially in areas where terrestrial broadband is weak, mobility applications are growing, or governments want independent communications capacity. Those themes give the company exposure to several growth vectors at once rather than relying on a single end market.
Its strategy for future expansion is coherent. Reusable launch systems can lower mission cost and increase launch frequency. Vertical integration gives the company more control over hardware, software, and supply chain execution. The communications network adds a recurring revenue layer that is structurally different from one-off launch contracts. In theory, that combination can produce a stronger business over time: launch capabilities support satellite deployment, satellite deployment supports communications growth, and communications revenue can help fund the next generation of space systems.
Recent operating trends reinforce the growth case. Revenue growth near 92% year over year is far above what is typical in aerospace and defense. That does not automatically mean durable profitability, but it does indicate expanding commercial traction. A major catalyst remains the continued scaling of satellite connectivity services for consumers, enterprise users, aviation, maritime, and government customers. Another catalyst is the possibility that higher launch cadence and larger national security roles could deepen barriers to entry.
A further opportunity comes from next-generation platforms. If larger launch systems, upgraded satellites, or broader government programs move from development into regular operations, the company could strengthen both its addressable market and its cost position. In a sector where technical capability, launch reliability, and production scale matter enormously, successful execution on these programs could reshape the company’s earnings power over a multiyear period.
Risks
This article is for informational purposes only and does not constitute financial advice. Some content is AI-generated. See Disclaimer